Landmark Analysis of Homarus americanus including outlines of ESD lesions, etc.
Introduction
Part of my interest in American lobsters is their shapes and how Epizootic Shell Disease (ESD) lesions fit into their shape. Early on we in the lobster shell disease community observed that the lesions often centered on the dorsal of the carapace where we noticed that grooming using their leg claws was not reachable. This was also confounded with the development of an approach to estimating the coverage of the carapace with ESD on a 0-3 point scale of ESD severity developed by Bruce Estrella (Smolowitz et al. 2005).
| 0 | = | no shell disease symptoms | 1 | = | shell disease symptoms on 1–10% of the shell surface |
| 2 | = | shell disease symptoms on 11–50% of the shell surface |
| 3 | = | shell disease symptoms on >50% of the shell surface | * | Presented by B. Estrella to the Lobster Shell Disease Workshop, Connecticut Sea Grant College Program, Waterford, CT, June 15, 2000. |
Given that the estimation of ESD coverage was to be a practical scale to apply perhaps at sea during a sorting operation it was thought we should validate the approach quantitatively based on how the sorting was done. Here we present an approach to quantify the visual scale on a group of lobsters for which we were taking landmarks of the carapace.
Methodology
Landmark analysis is described for two dimensions by Rohlf and Slice (1990) and generalized to three dimensions. A 3-D digitizer was used to collect the x,y,z-locations of twelve landmarks that were known to be homologous in all individuals unless obscured by an encrustation or a lesion. A Microscribe G2X digitizer was used to manually collect the locations of the landmarks in a lobster that was immobilized on a metal breadboard with convenient posts that could be adjusted for the lobster size, Fig 1.
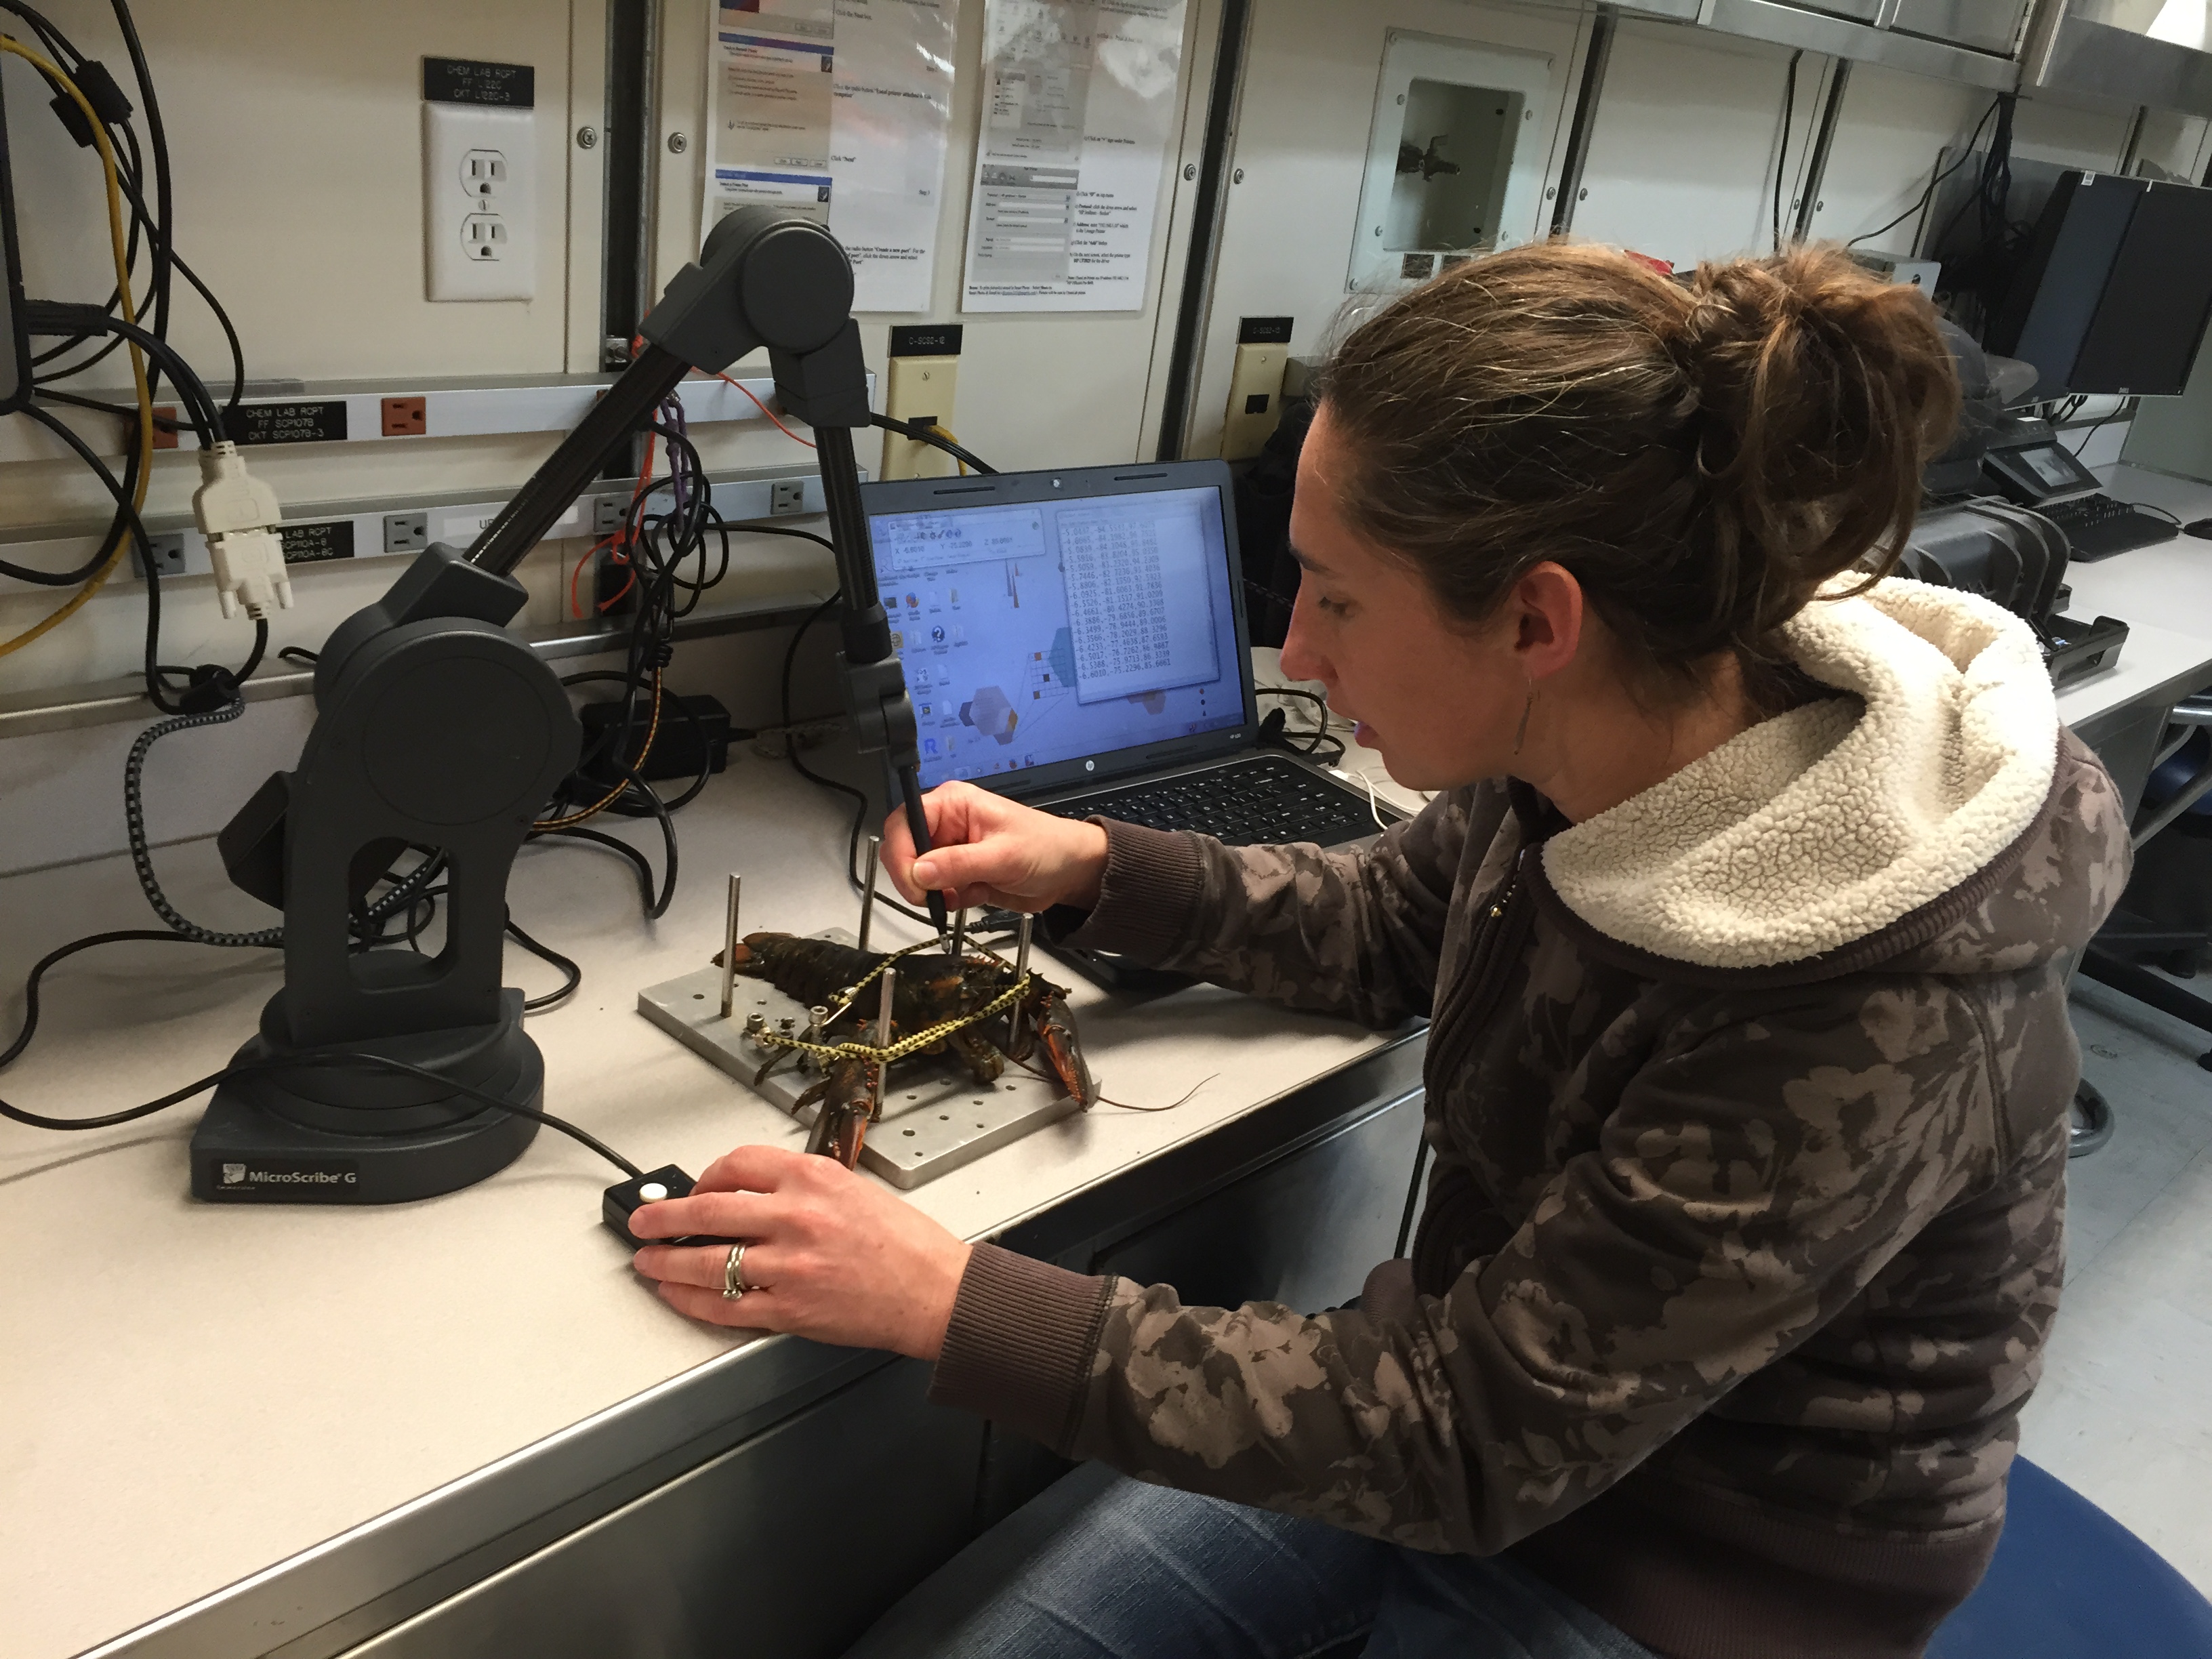
|
Two sets of landmarks were collected for each carapace sequentially so as to determine the reproducibility of the digitizer. A linear set of data which corresponds to the rout of the dorsal suture was recorded and plots in blue, additional linear records of lesion circumferences were recorded as appropriate fig 2.

|
The three dimensional surface of the carapace of the lobster was modeled using photogrammetry which takes several images of the surface of an object and stitches them together using the software Metashape ver. 1.6.5 (Semyonov 2018) to produce a three dimensional surface that can be overlain with the color and texture of the surface, looked at from any chosen angle and saved as an .obj file or save with various sized rotating videos.
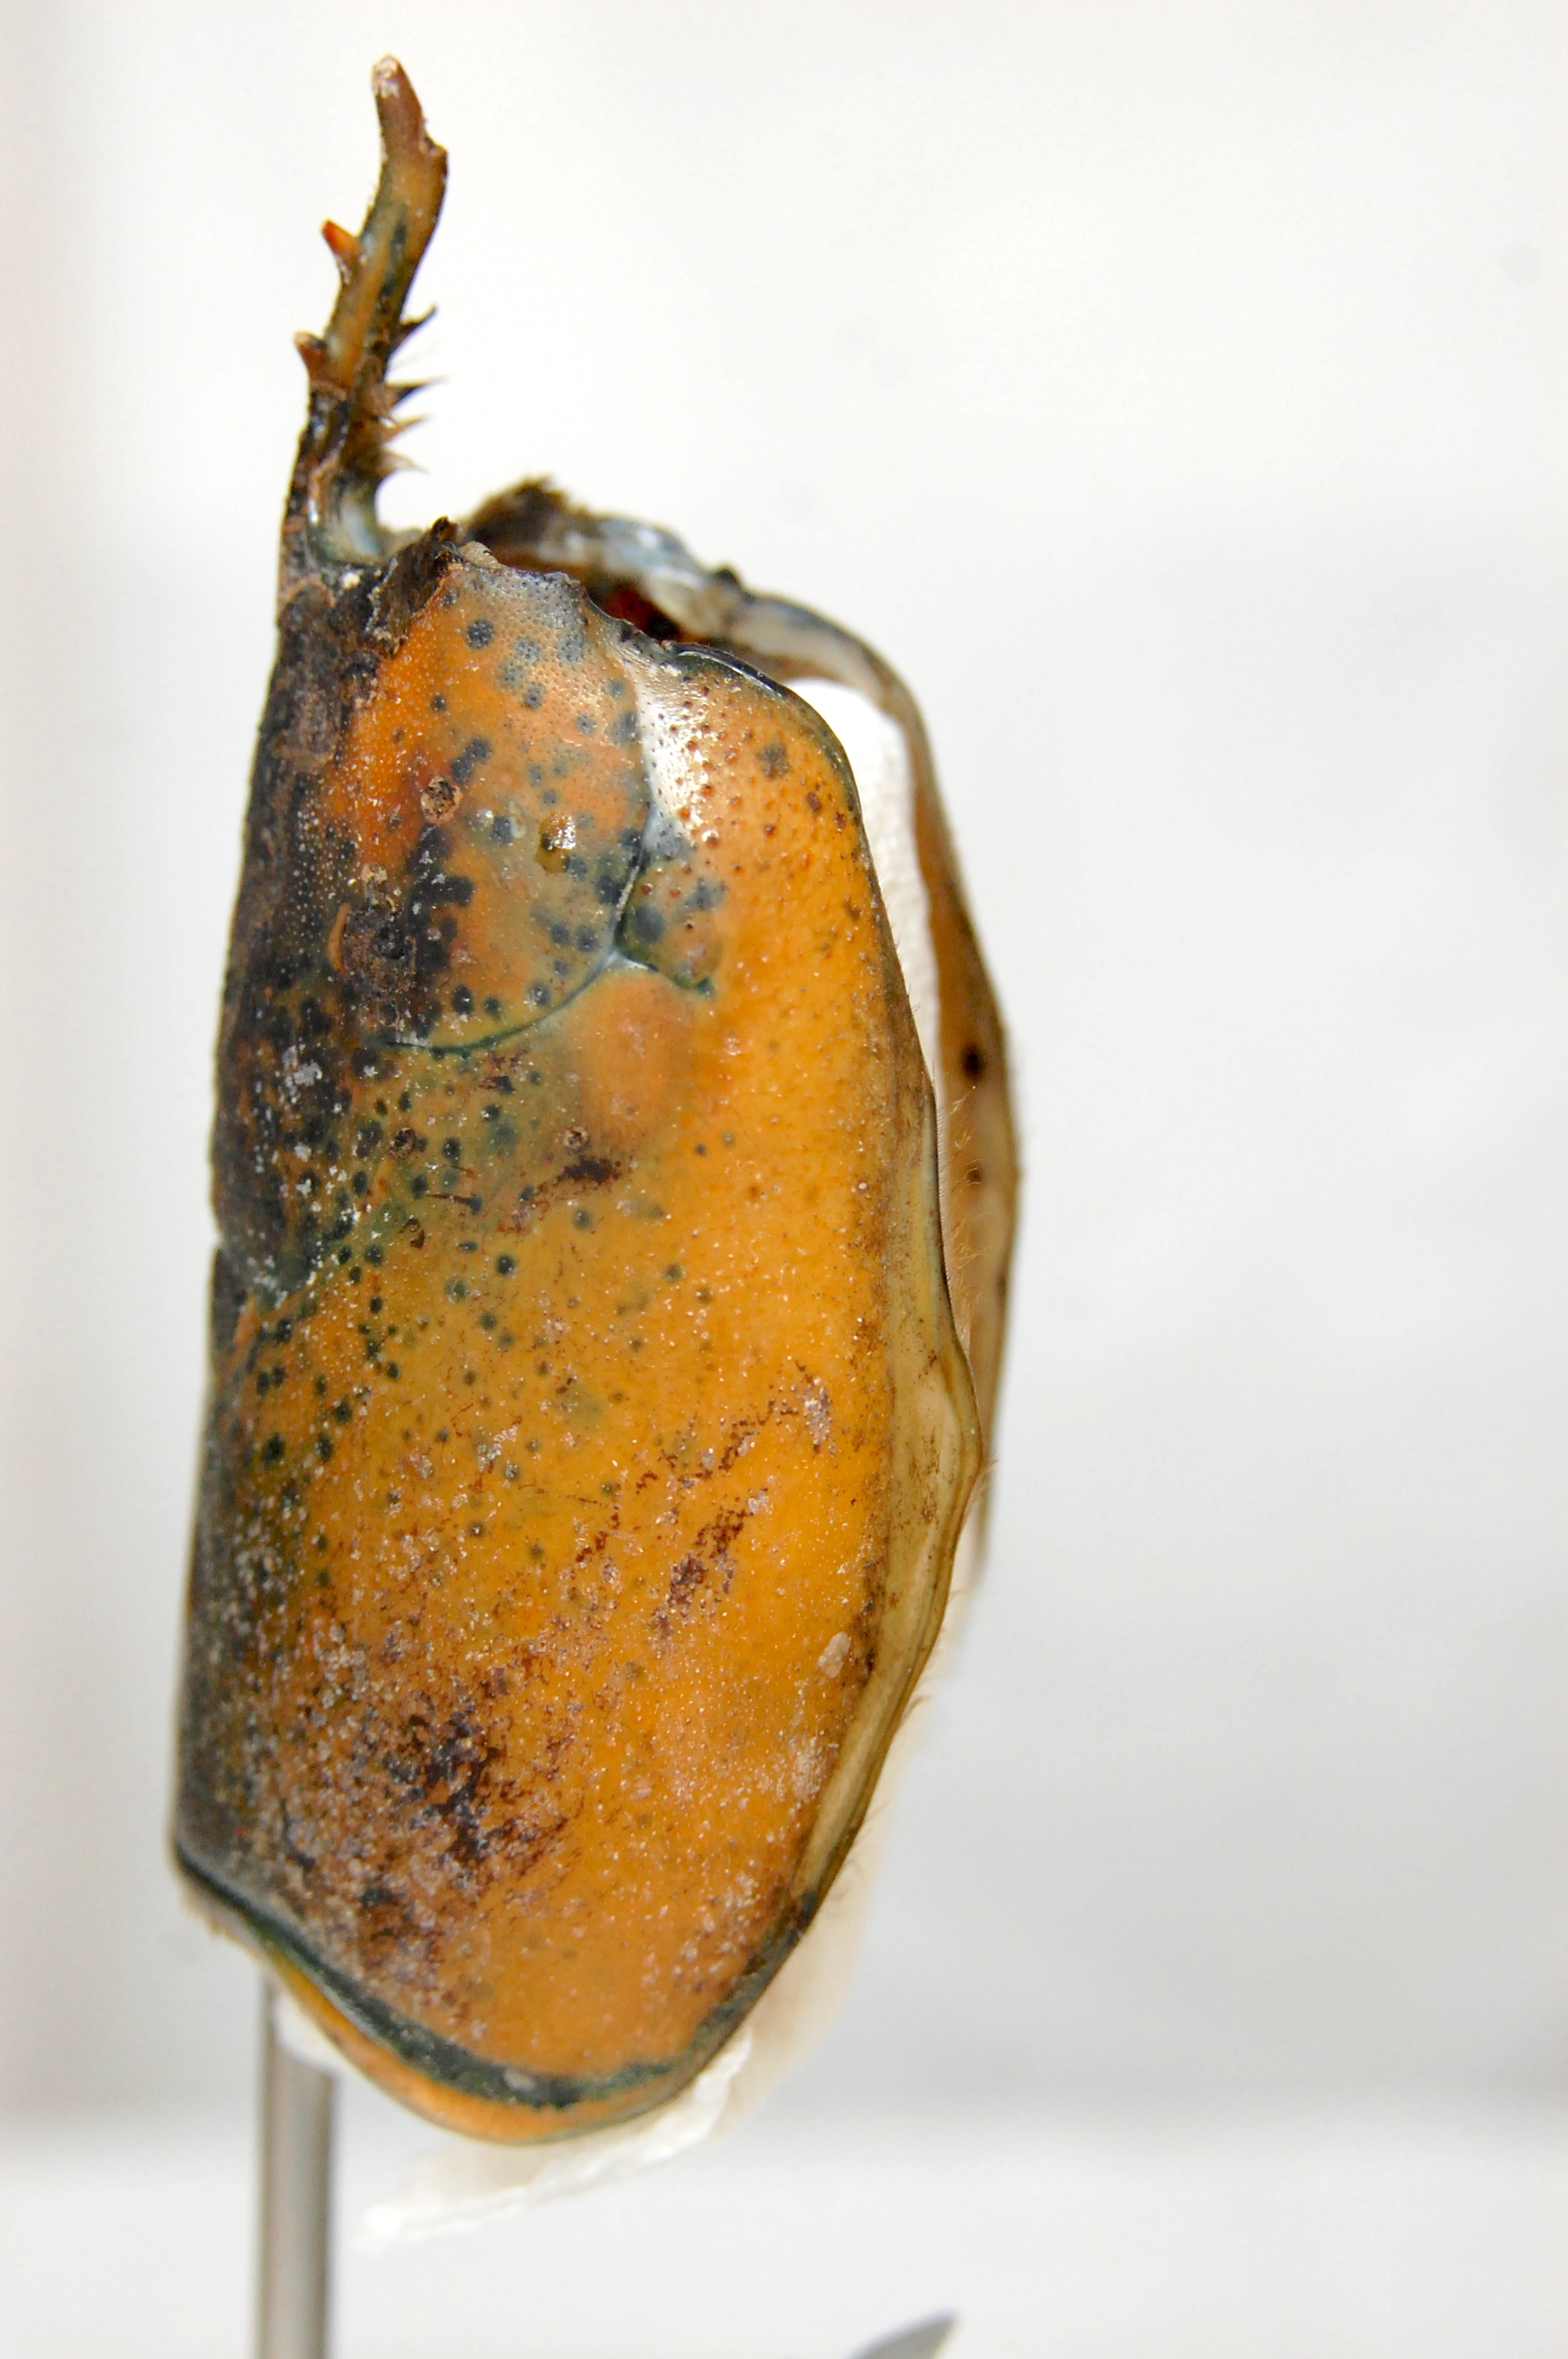
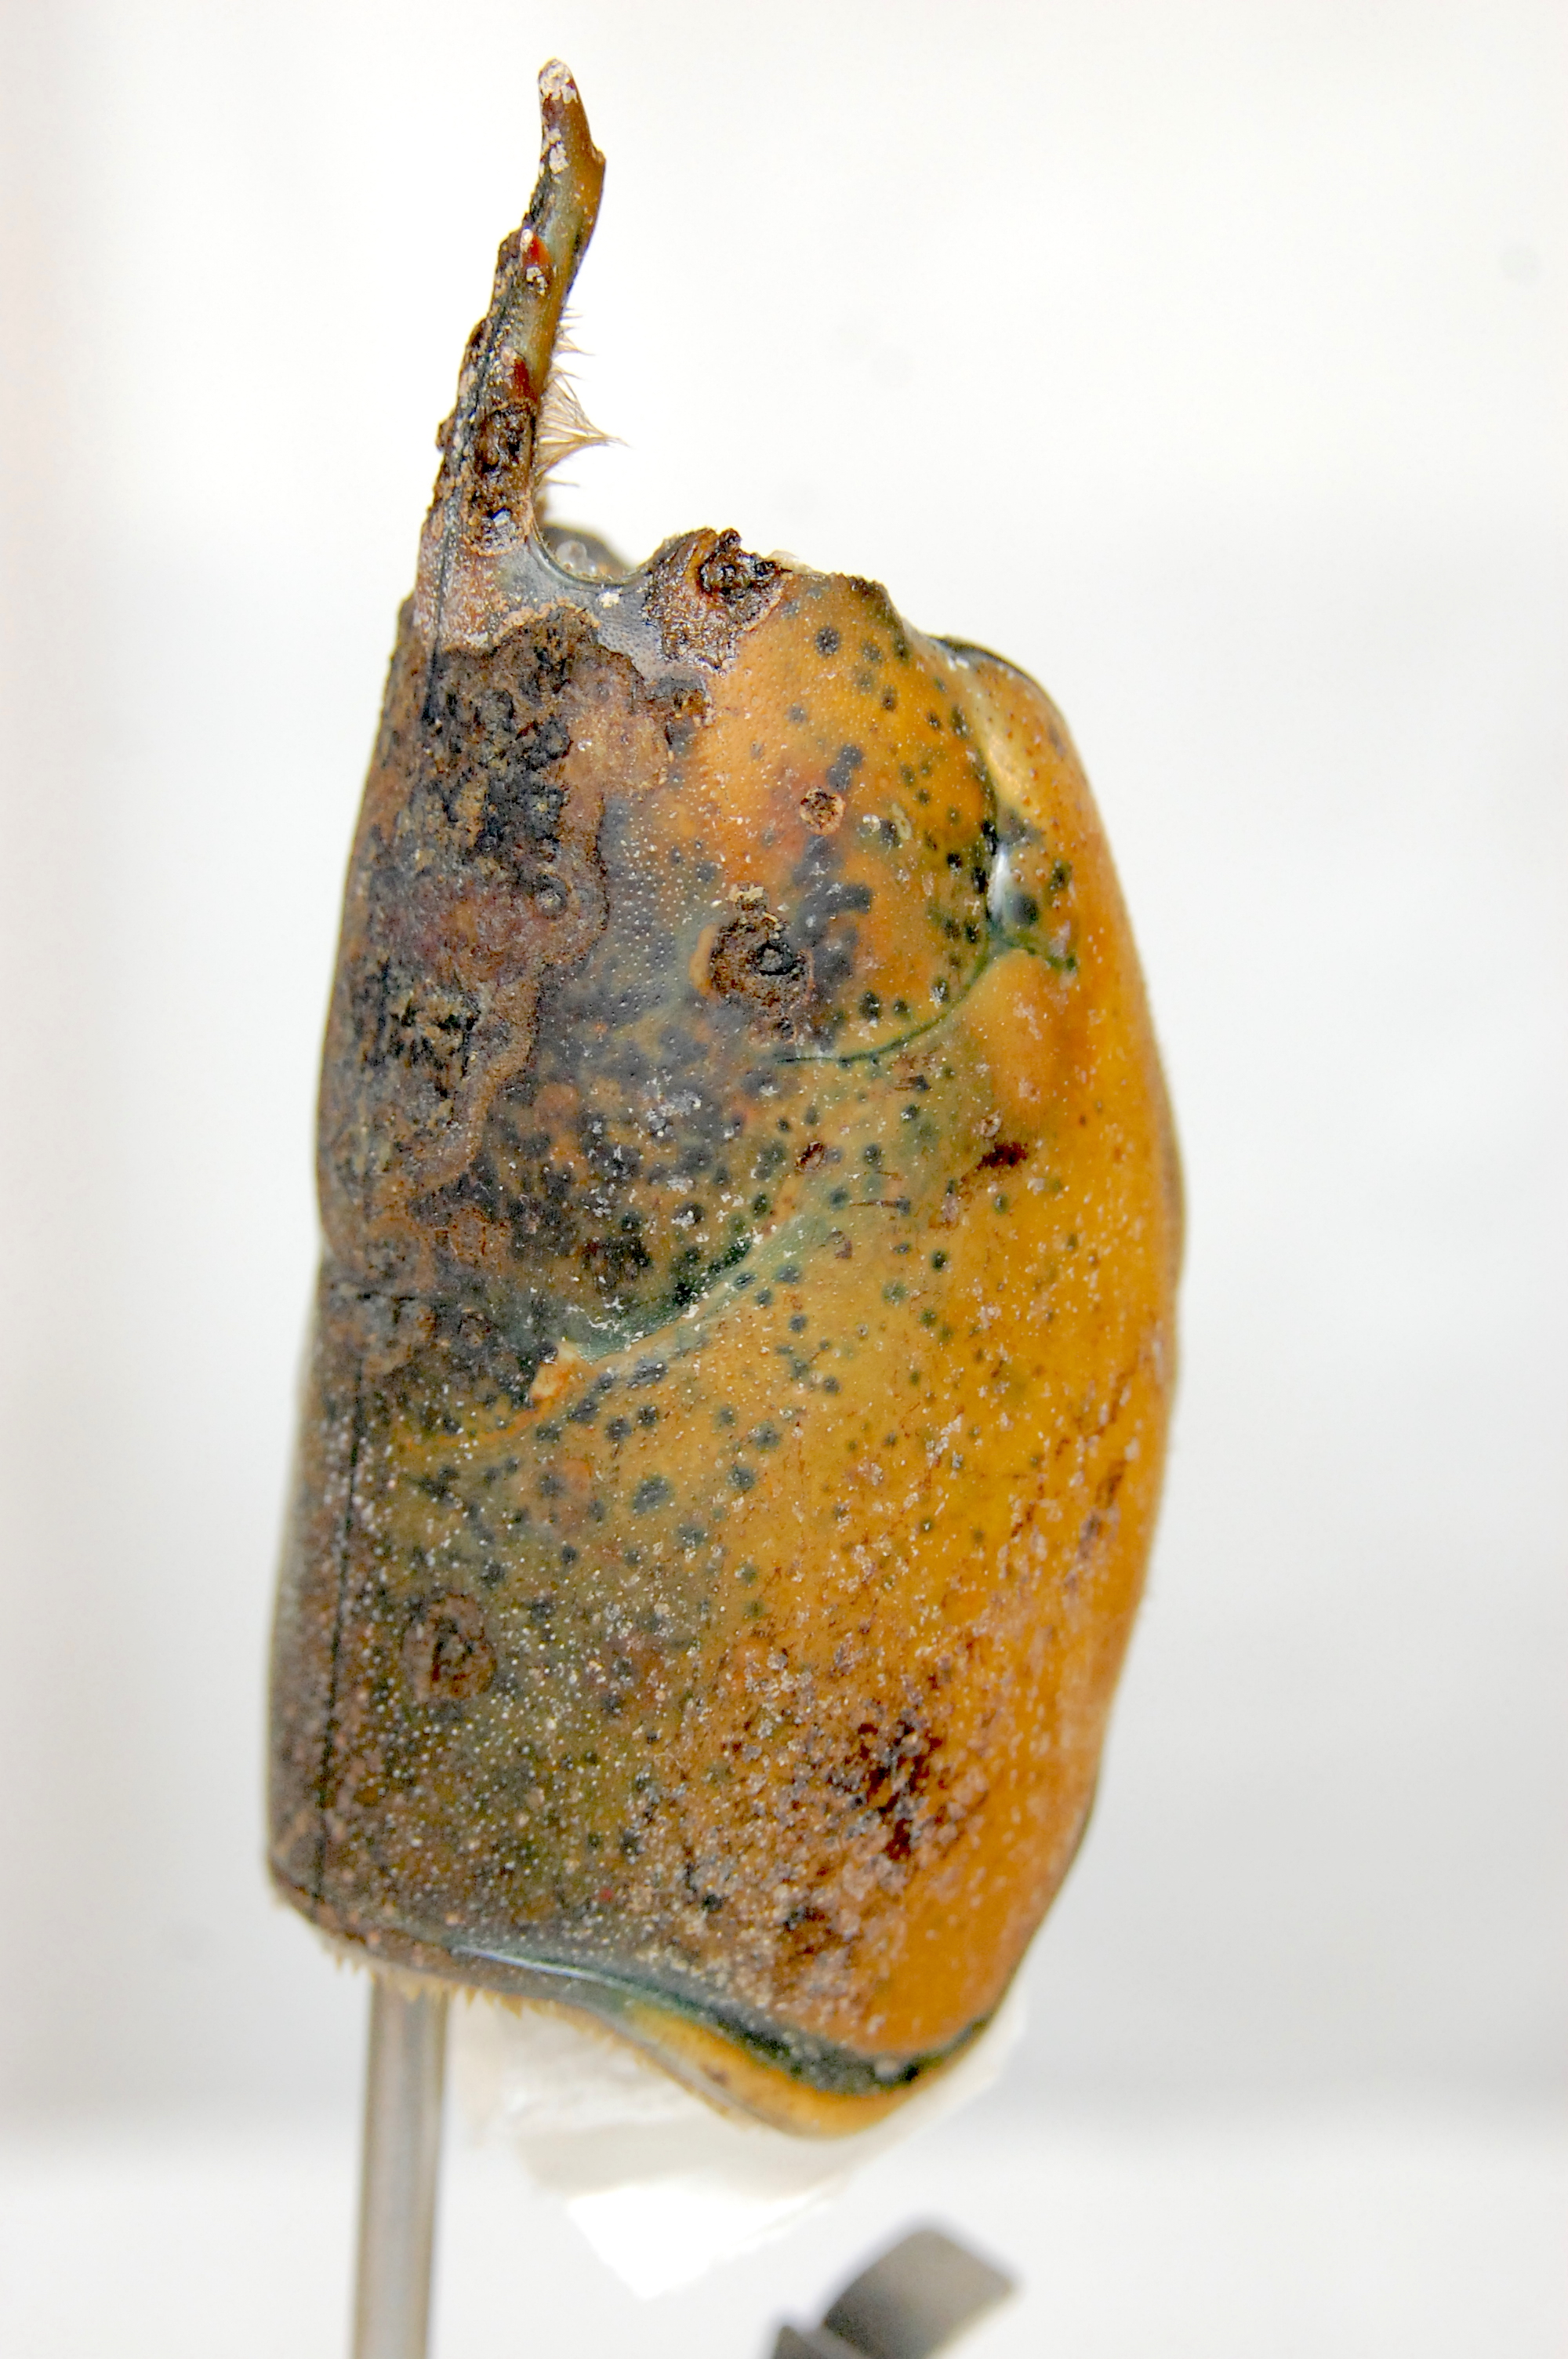
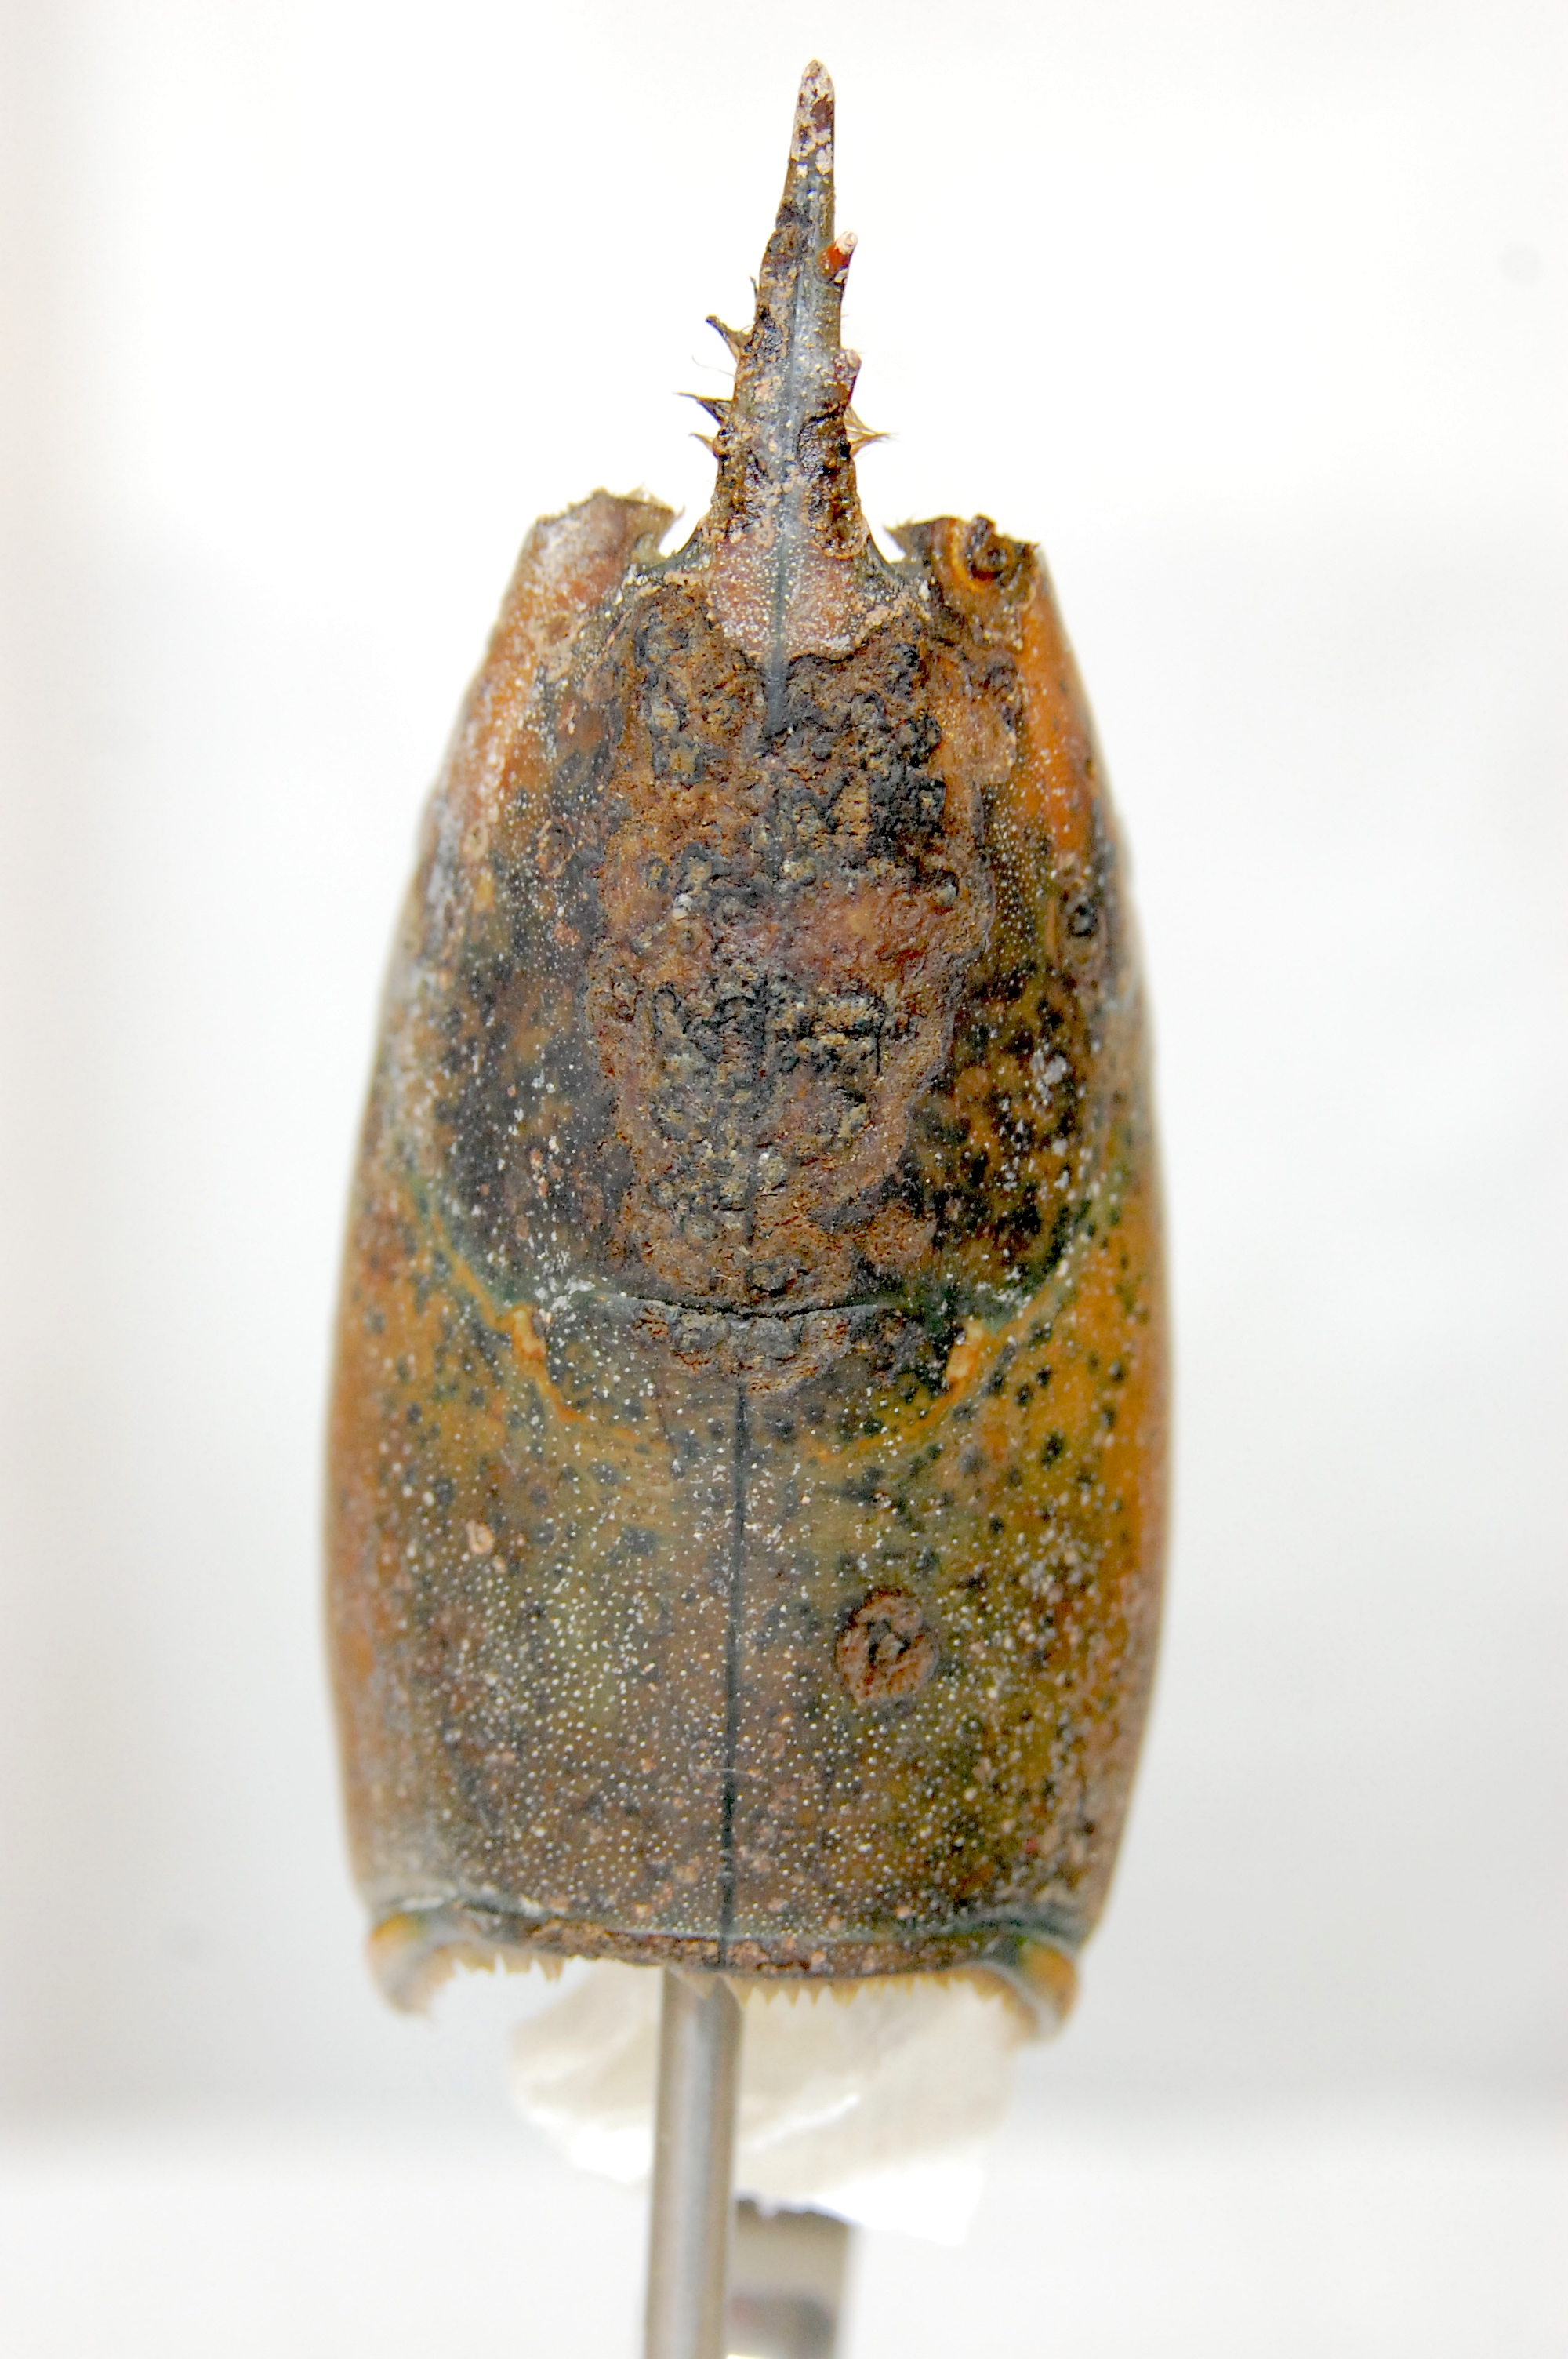
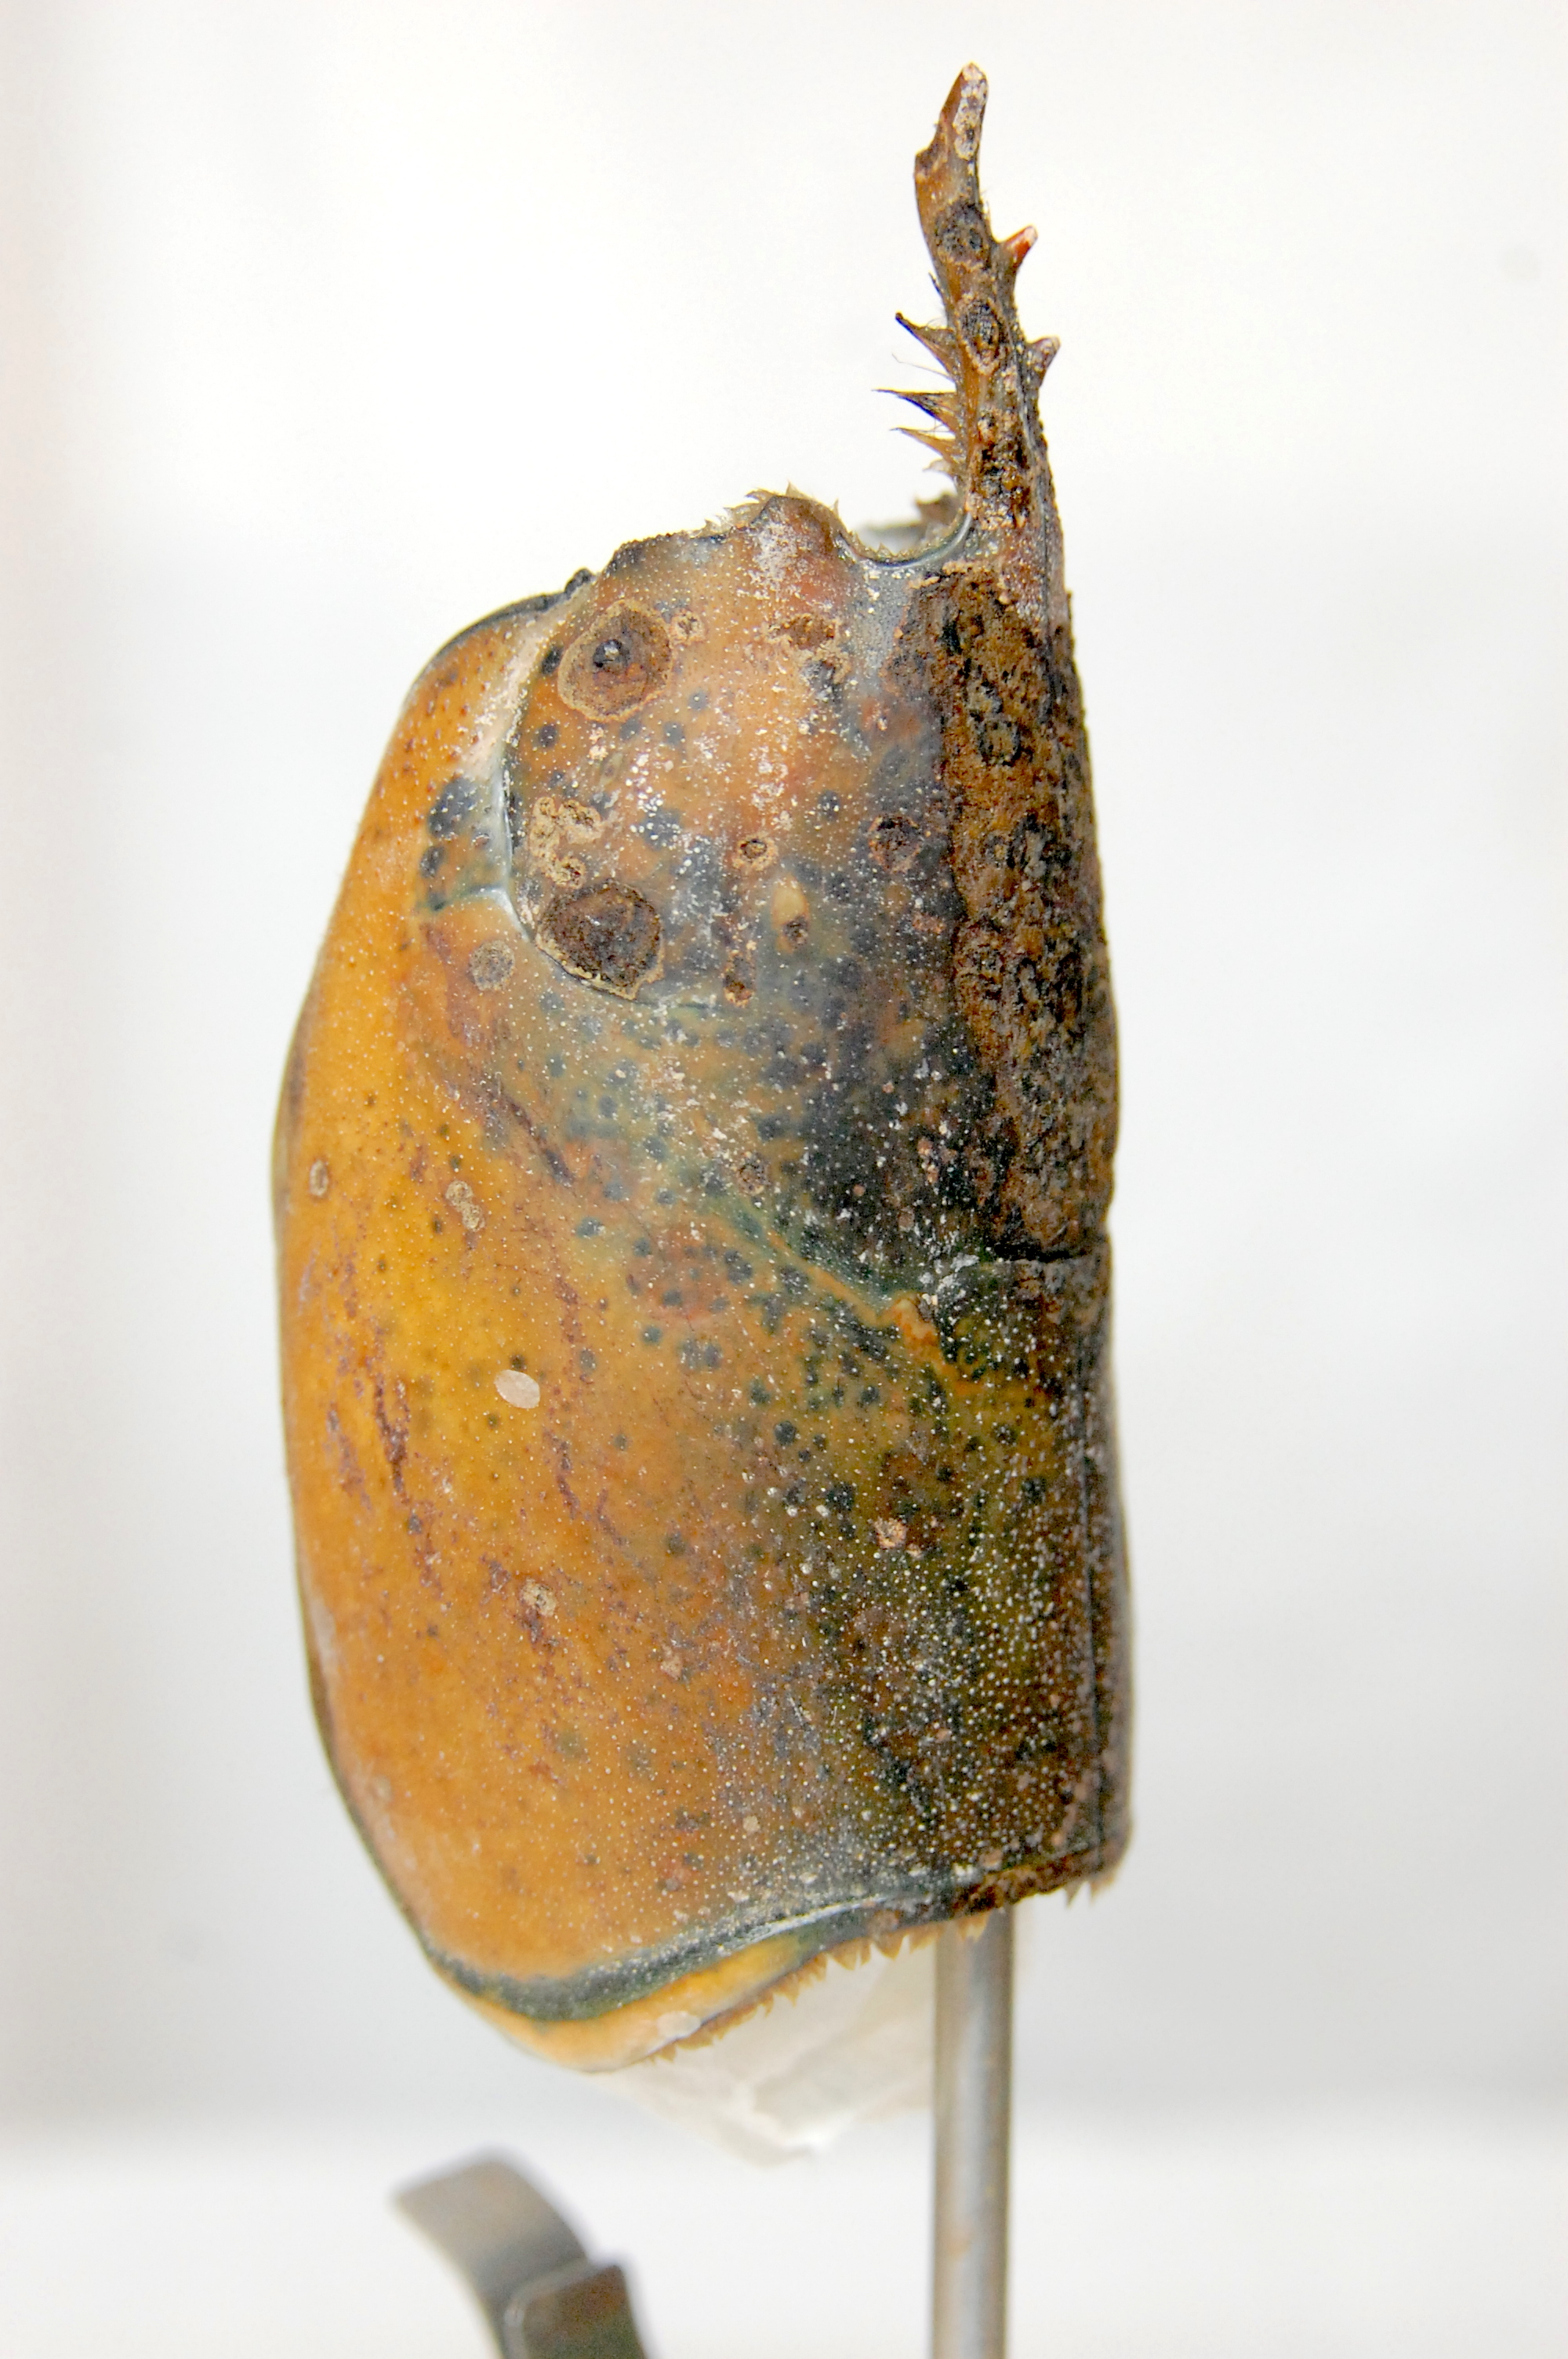
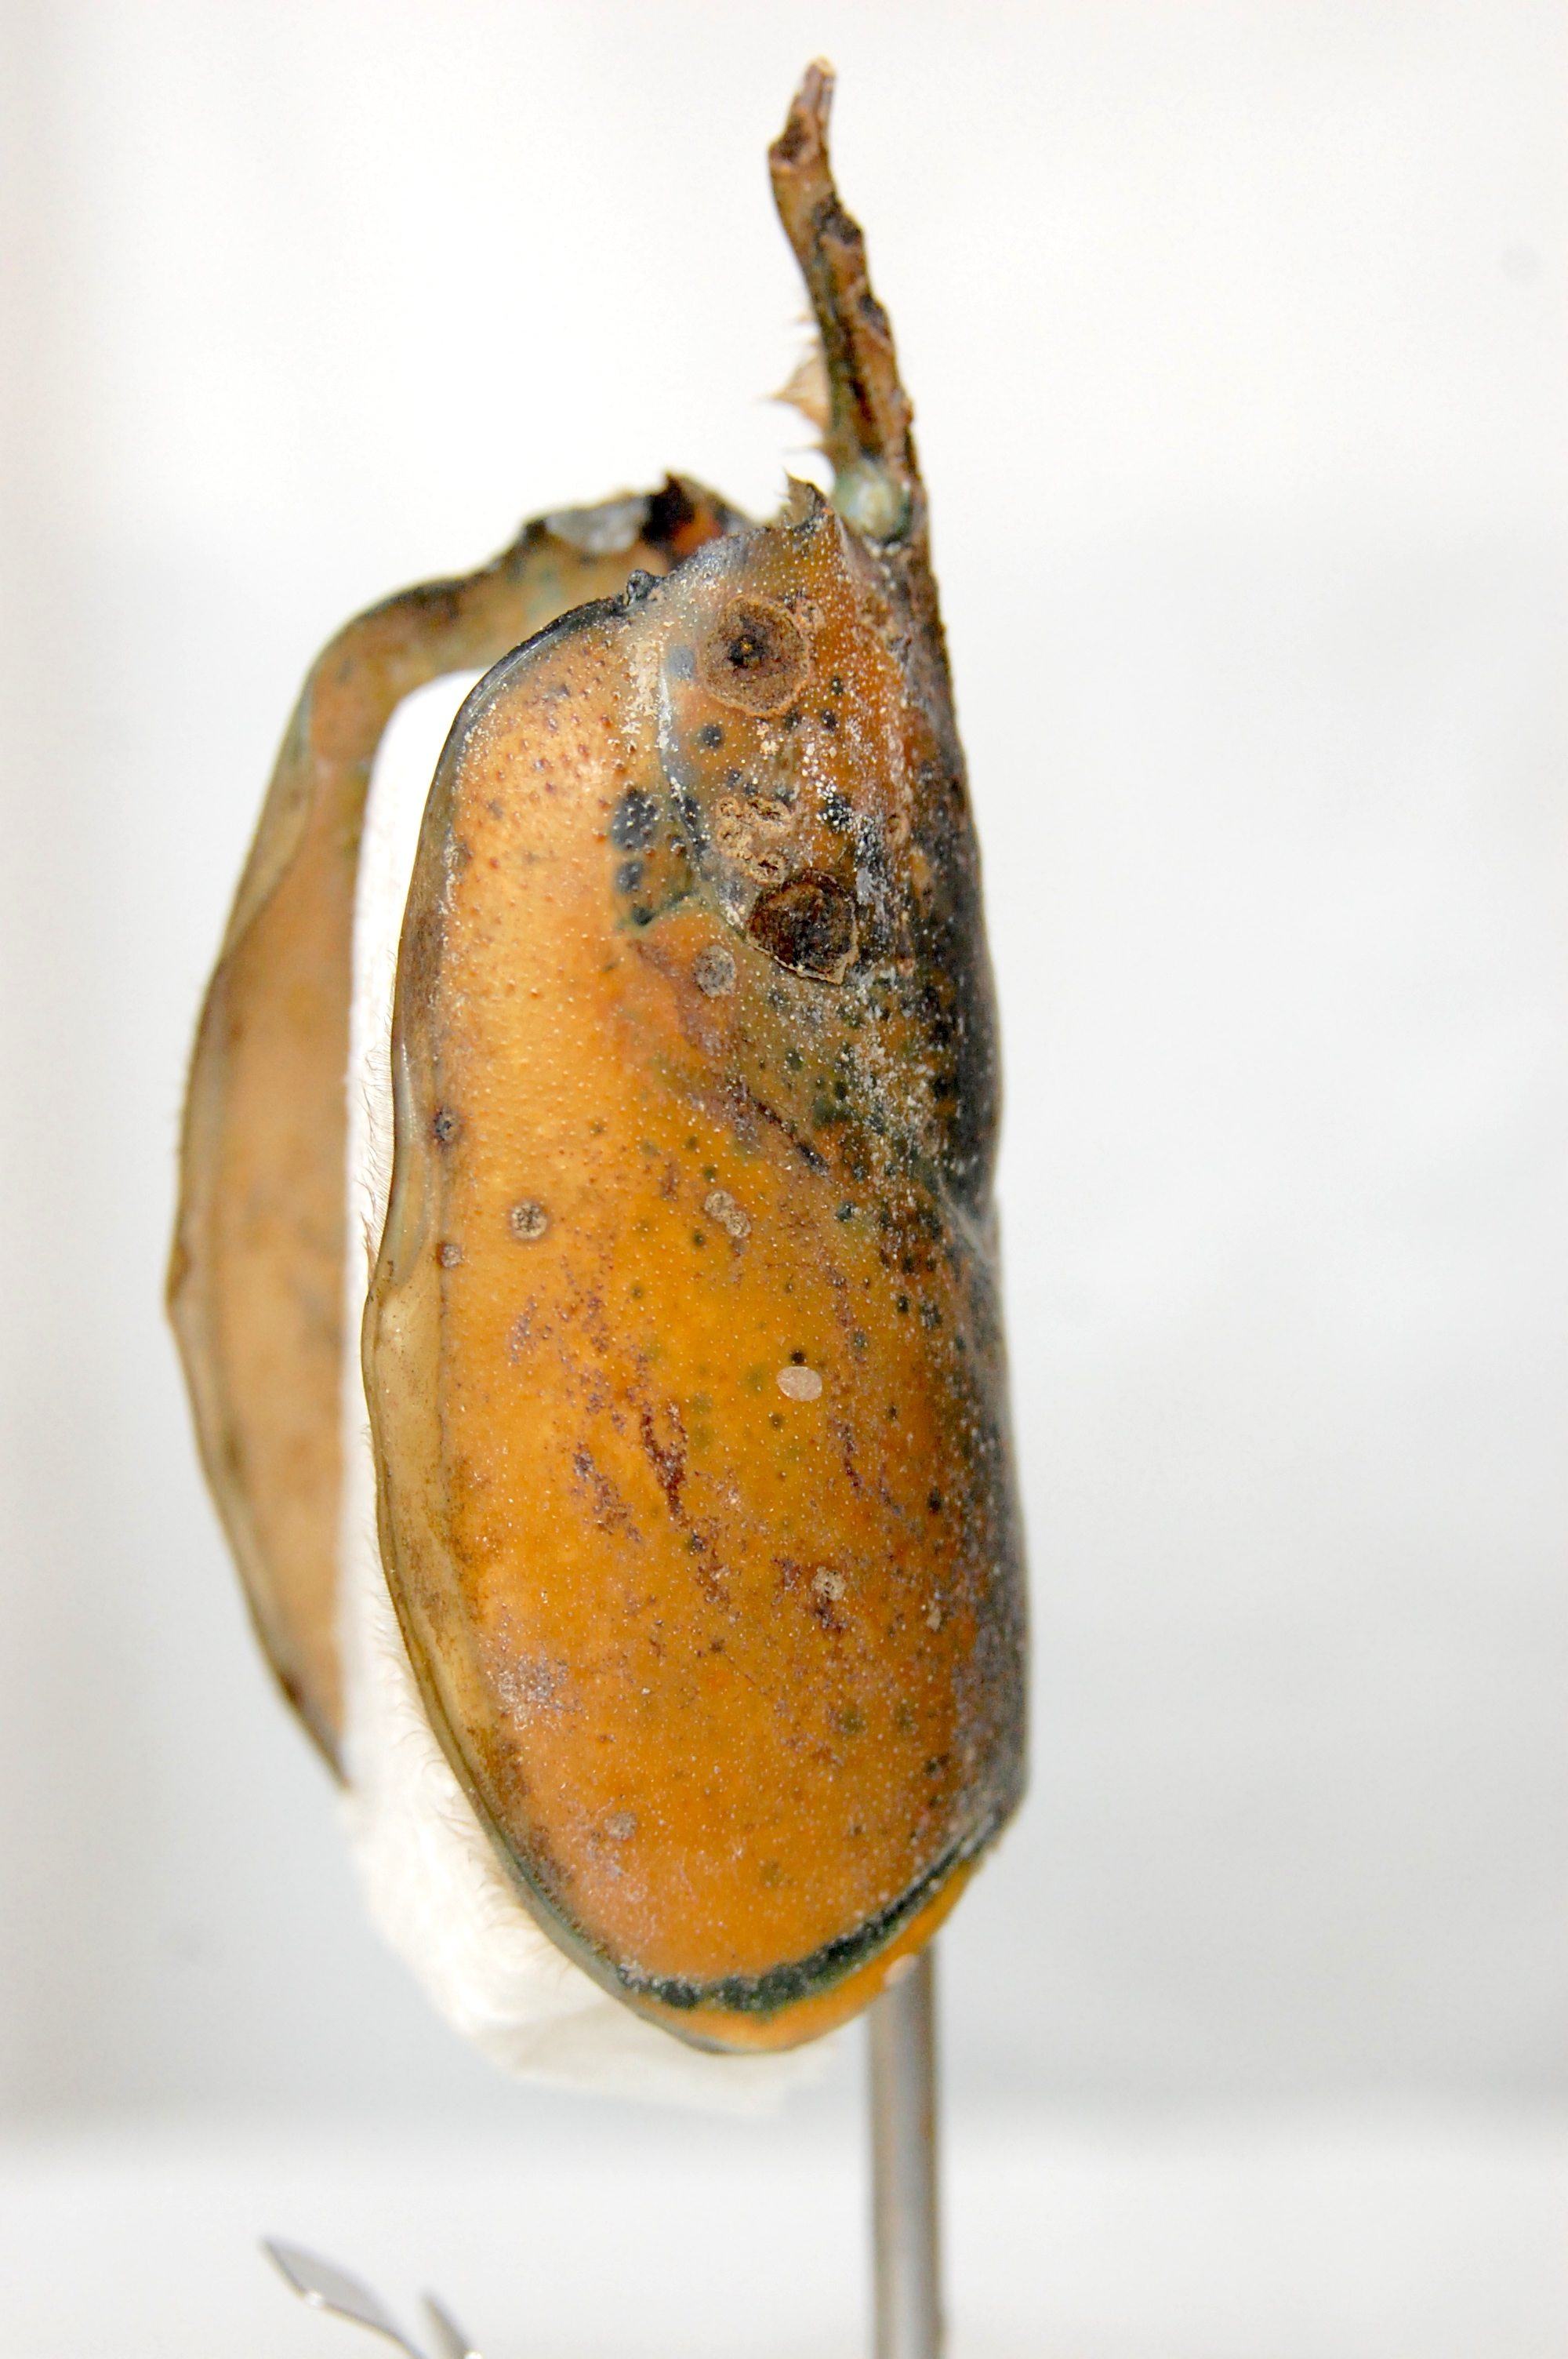
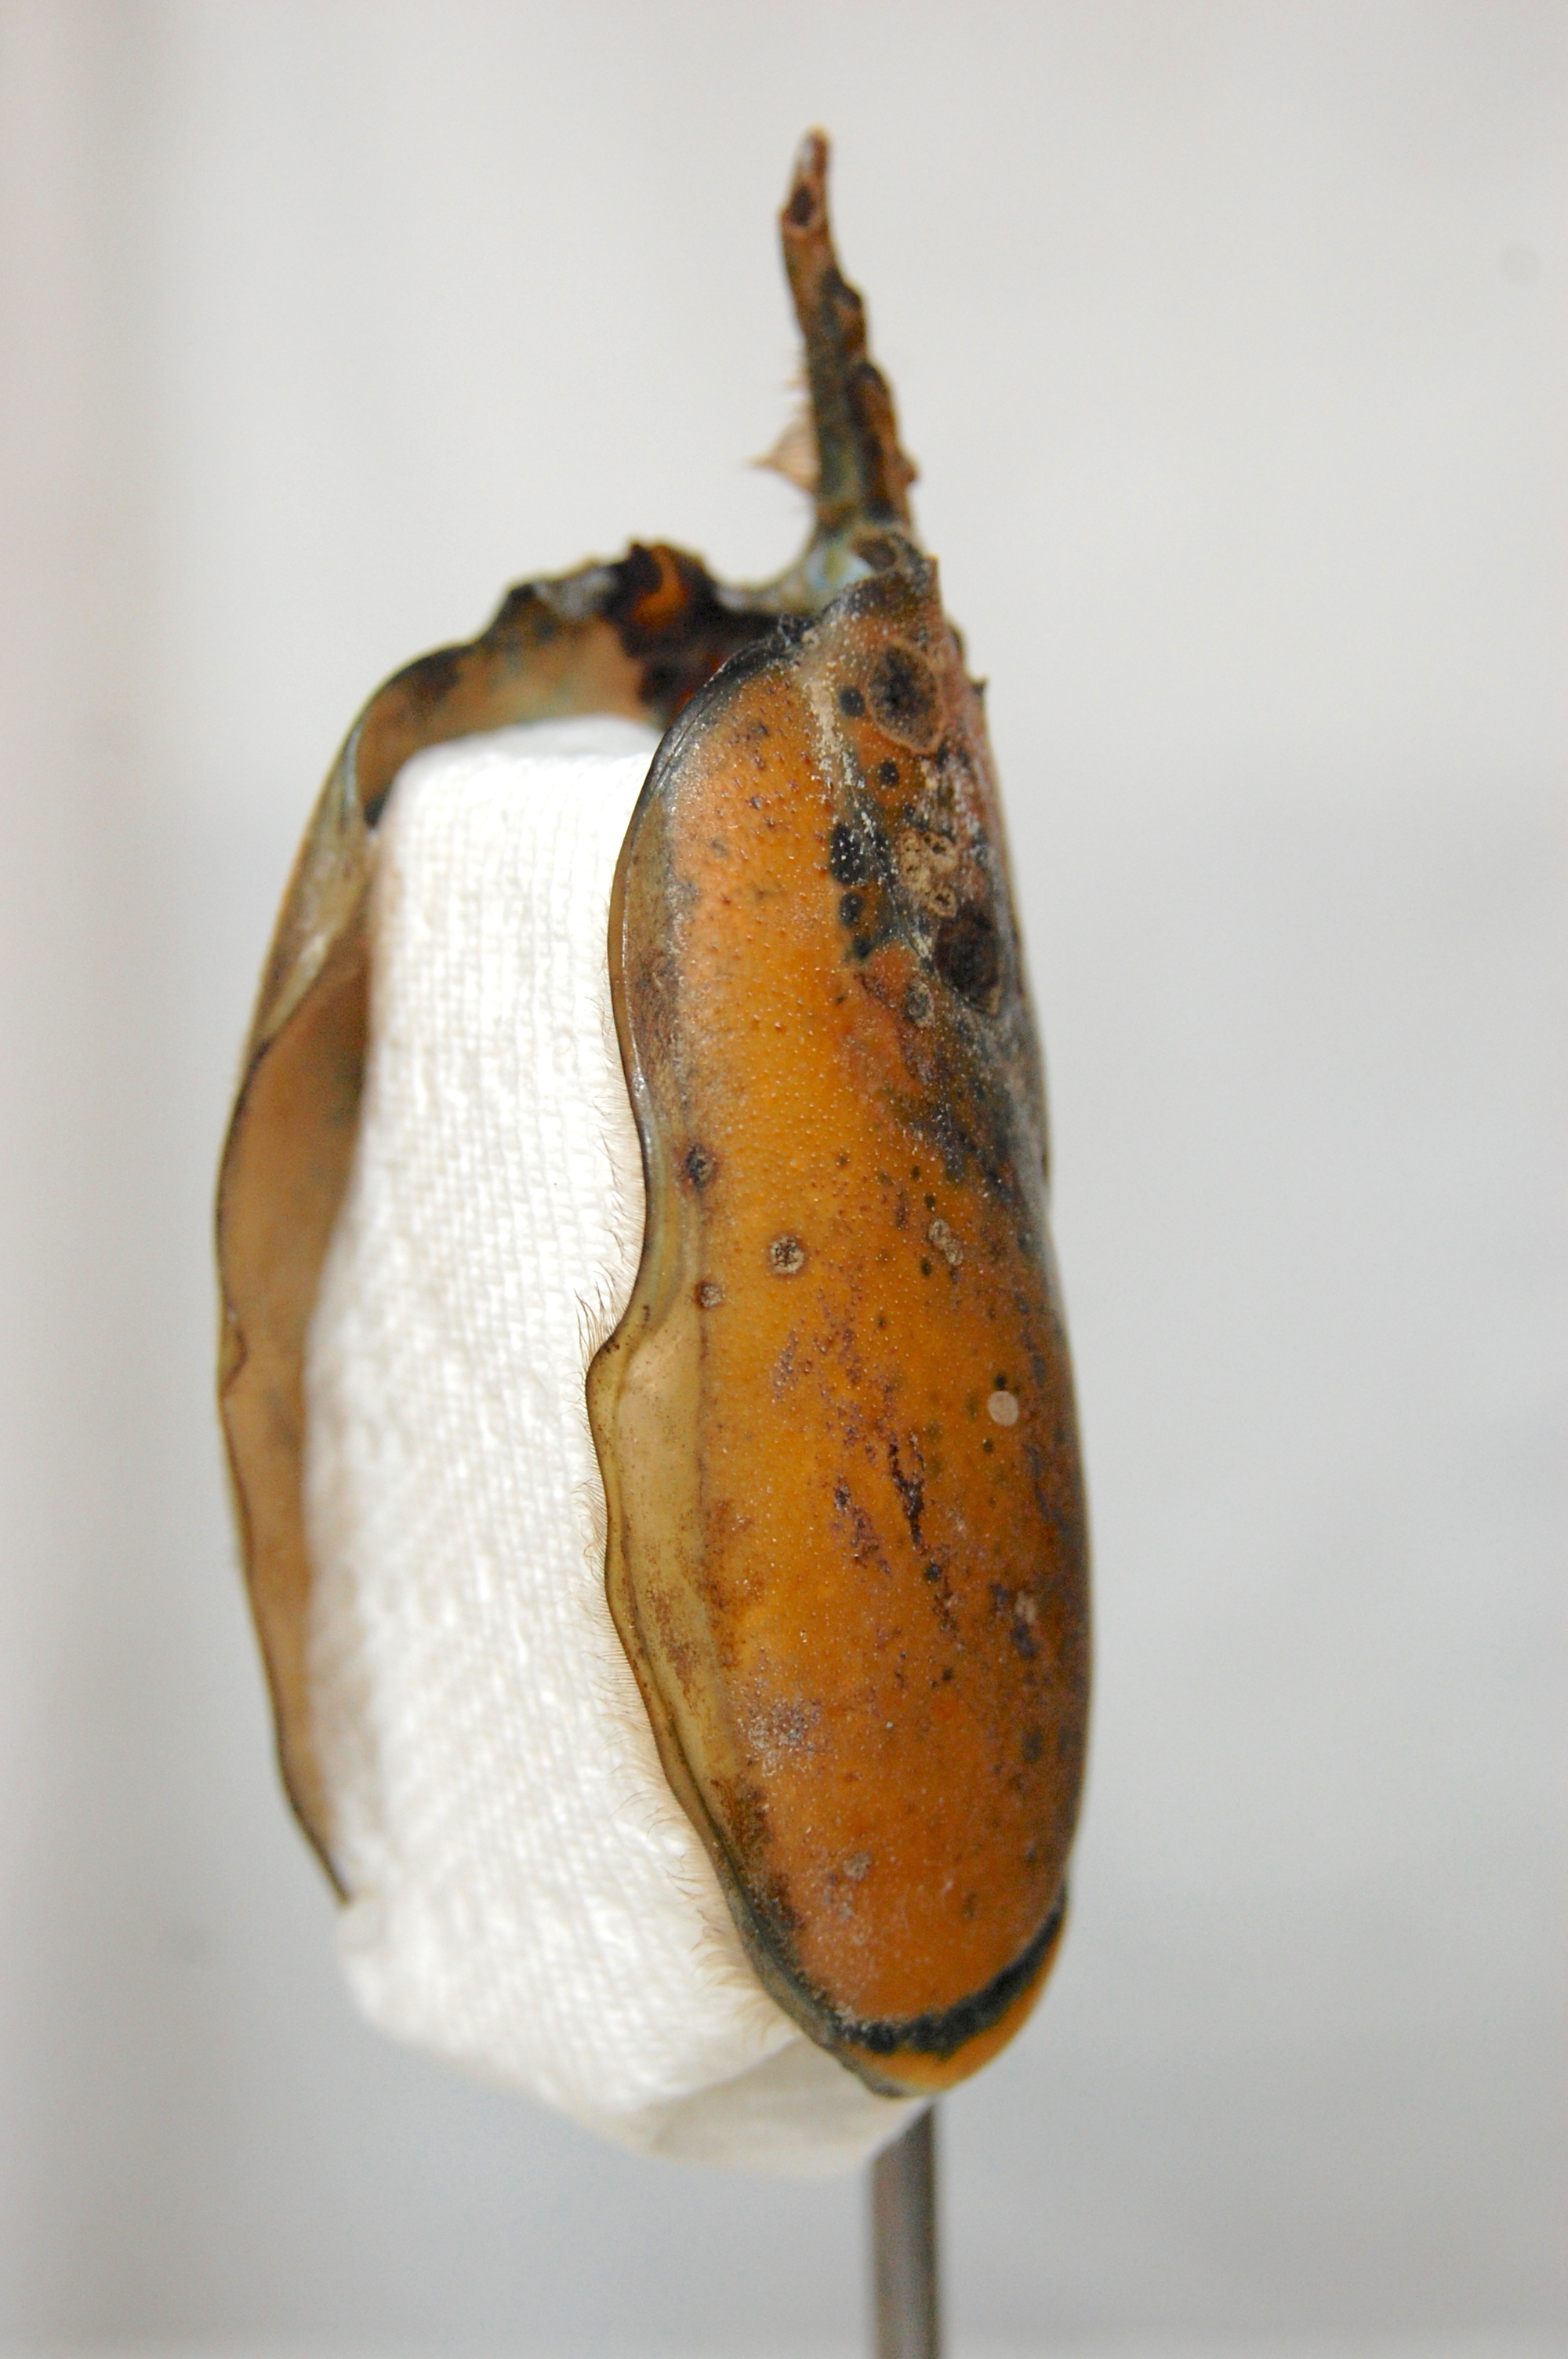
Each carapace, placed vertically on a rotatable base, is rotated manually by approximately 10 degrees in 10 to 12 steps and digital images of 2000 x 3008 pixels are taken with a tripod mounted digital camera (Nikon D40 w. 18-55mm Nikkor lens). The images, fig 3, are submitted to Metashape and merged into a 3-dimensional surface model masking out the non-carapace structures. Results are stored as an obj. file, can be examined further with Metashape, or separately with Meshlab (Berejnov 2009) to point to structures such as lesions or encrustations such as barnacles for quantification. Lesions can also be quantified by identifying their center and circumference using the Microscribe G2X digitizer, but that must be applied on the specimen itself while the Meshlab approach provides a method for quantification using the 3-D model stored as an .obj file. The meta-data on location, depth, temperature, date/time can then be stored with an emended .obj file in a database.
| A. Ha161 1 | Ha161 3 | Ha161 5 |
Ha161 7 | Ha161 9 | Ha161 11 | See Models |
 |
 |
 |
 |
 |
 |
B. SketchFab 3D Ha161-01 model C. AVI Video of Model |
- |
The three dimensional model .obj file can be loaded by a variety of secondary software, oriented and viewed optimally in a computer screen using the software Meshlab in which secondary notations can be added for landmarks, encrustations and lesions, fig 4.

|
The .obj file can be presented on the internet using the website Sketchfab allowing manual rotation and magnification by the viewer.
Results
Distribution of lobsters, lobster shape and ESD in the Northeast Groundfish Survey area concentrating on the Features of the Gulf of Maine and Georges Bank.
ESD Lesion Development based on Photogrammetry Models
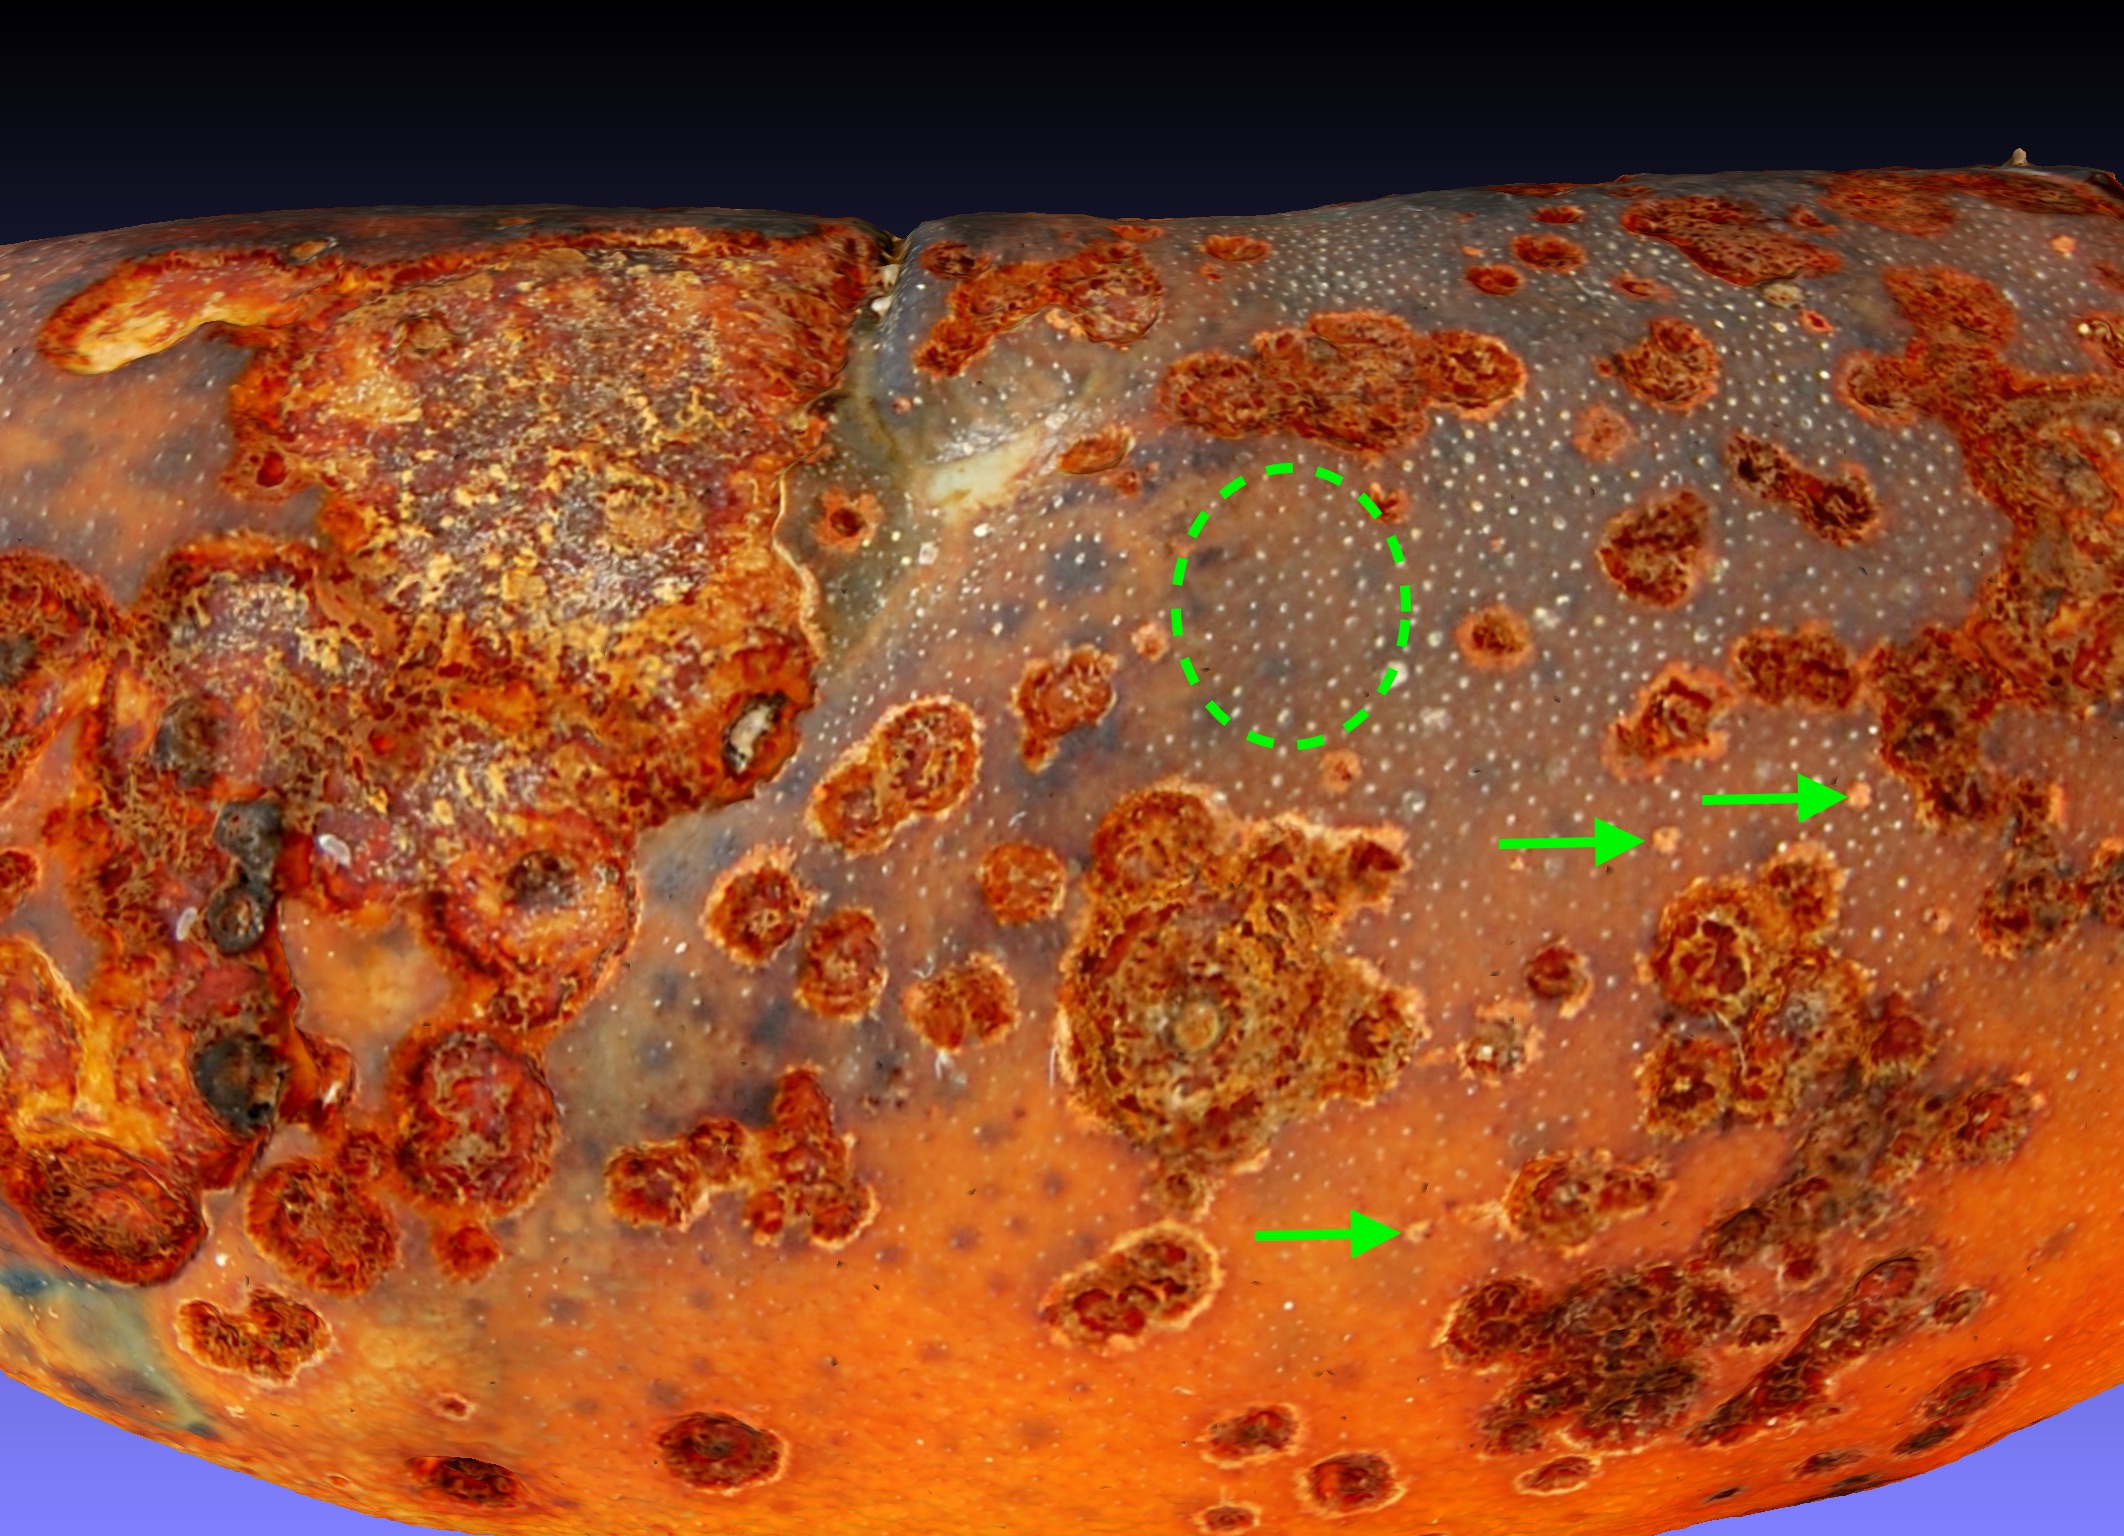
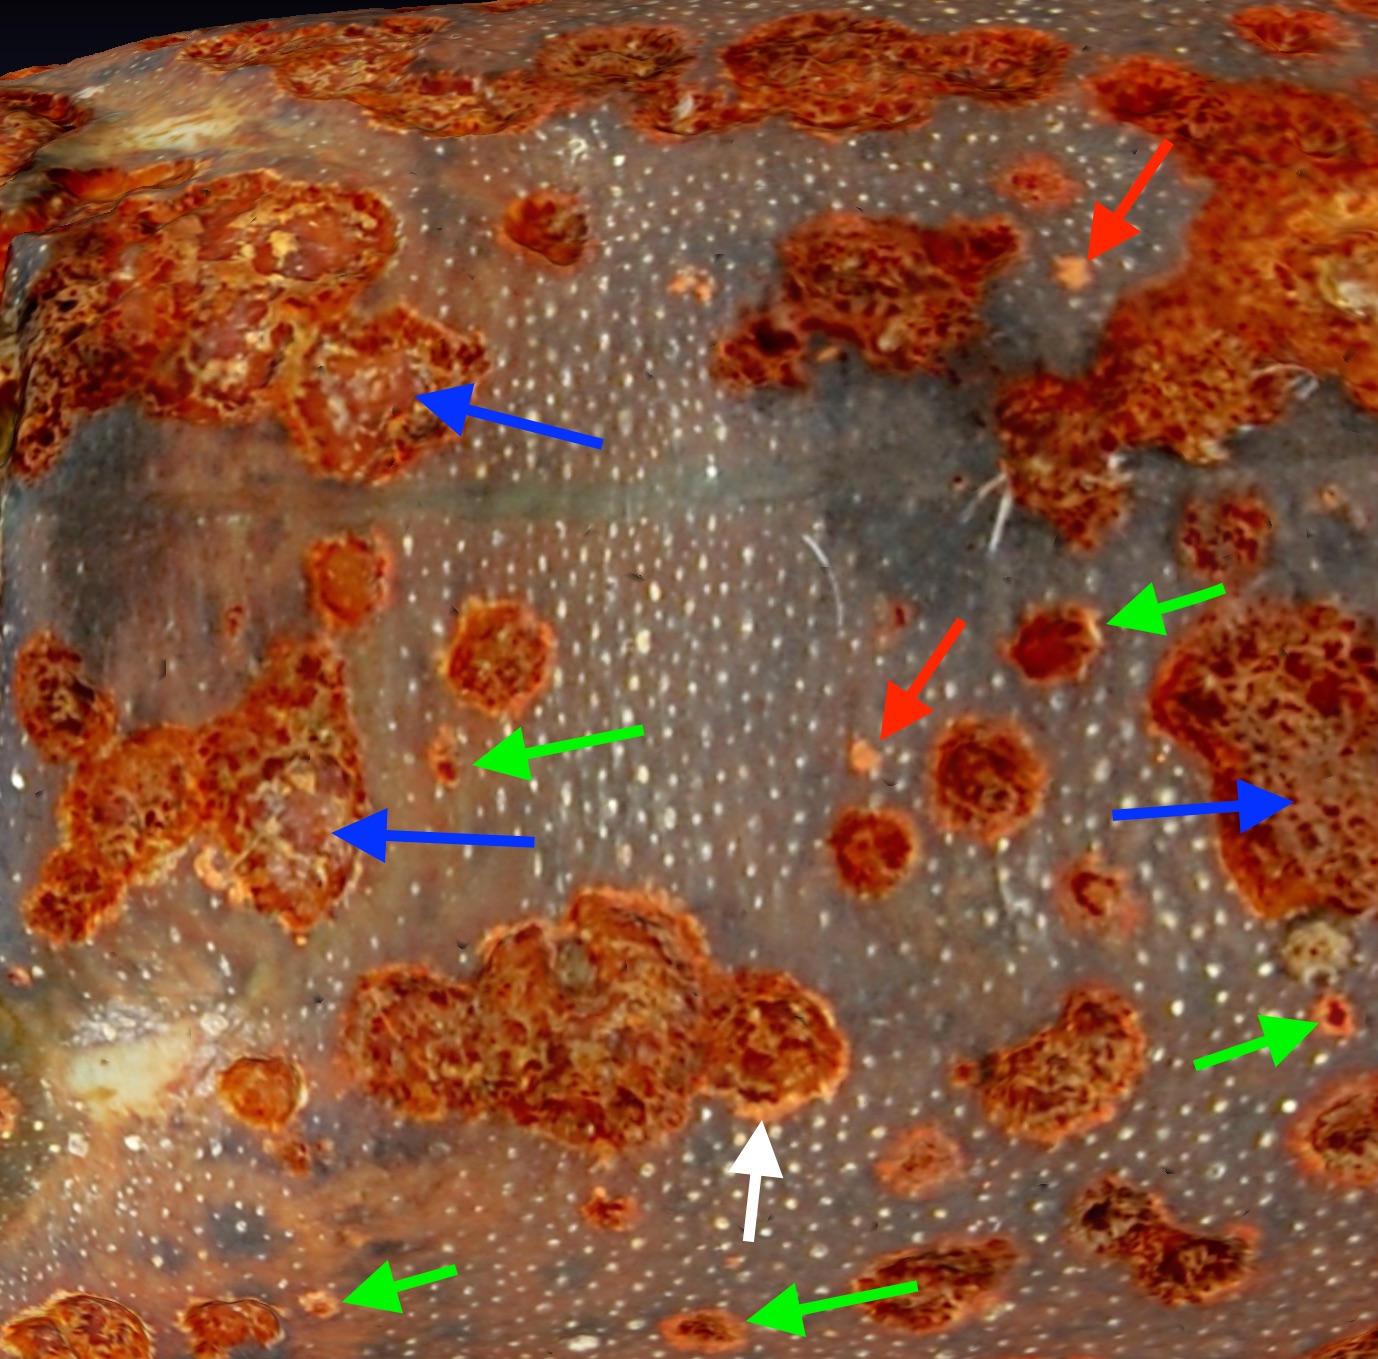
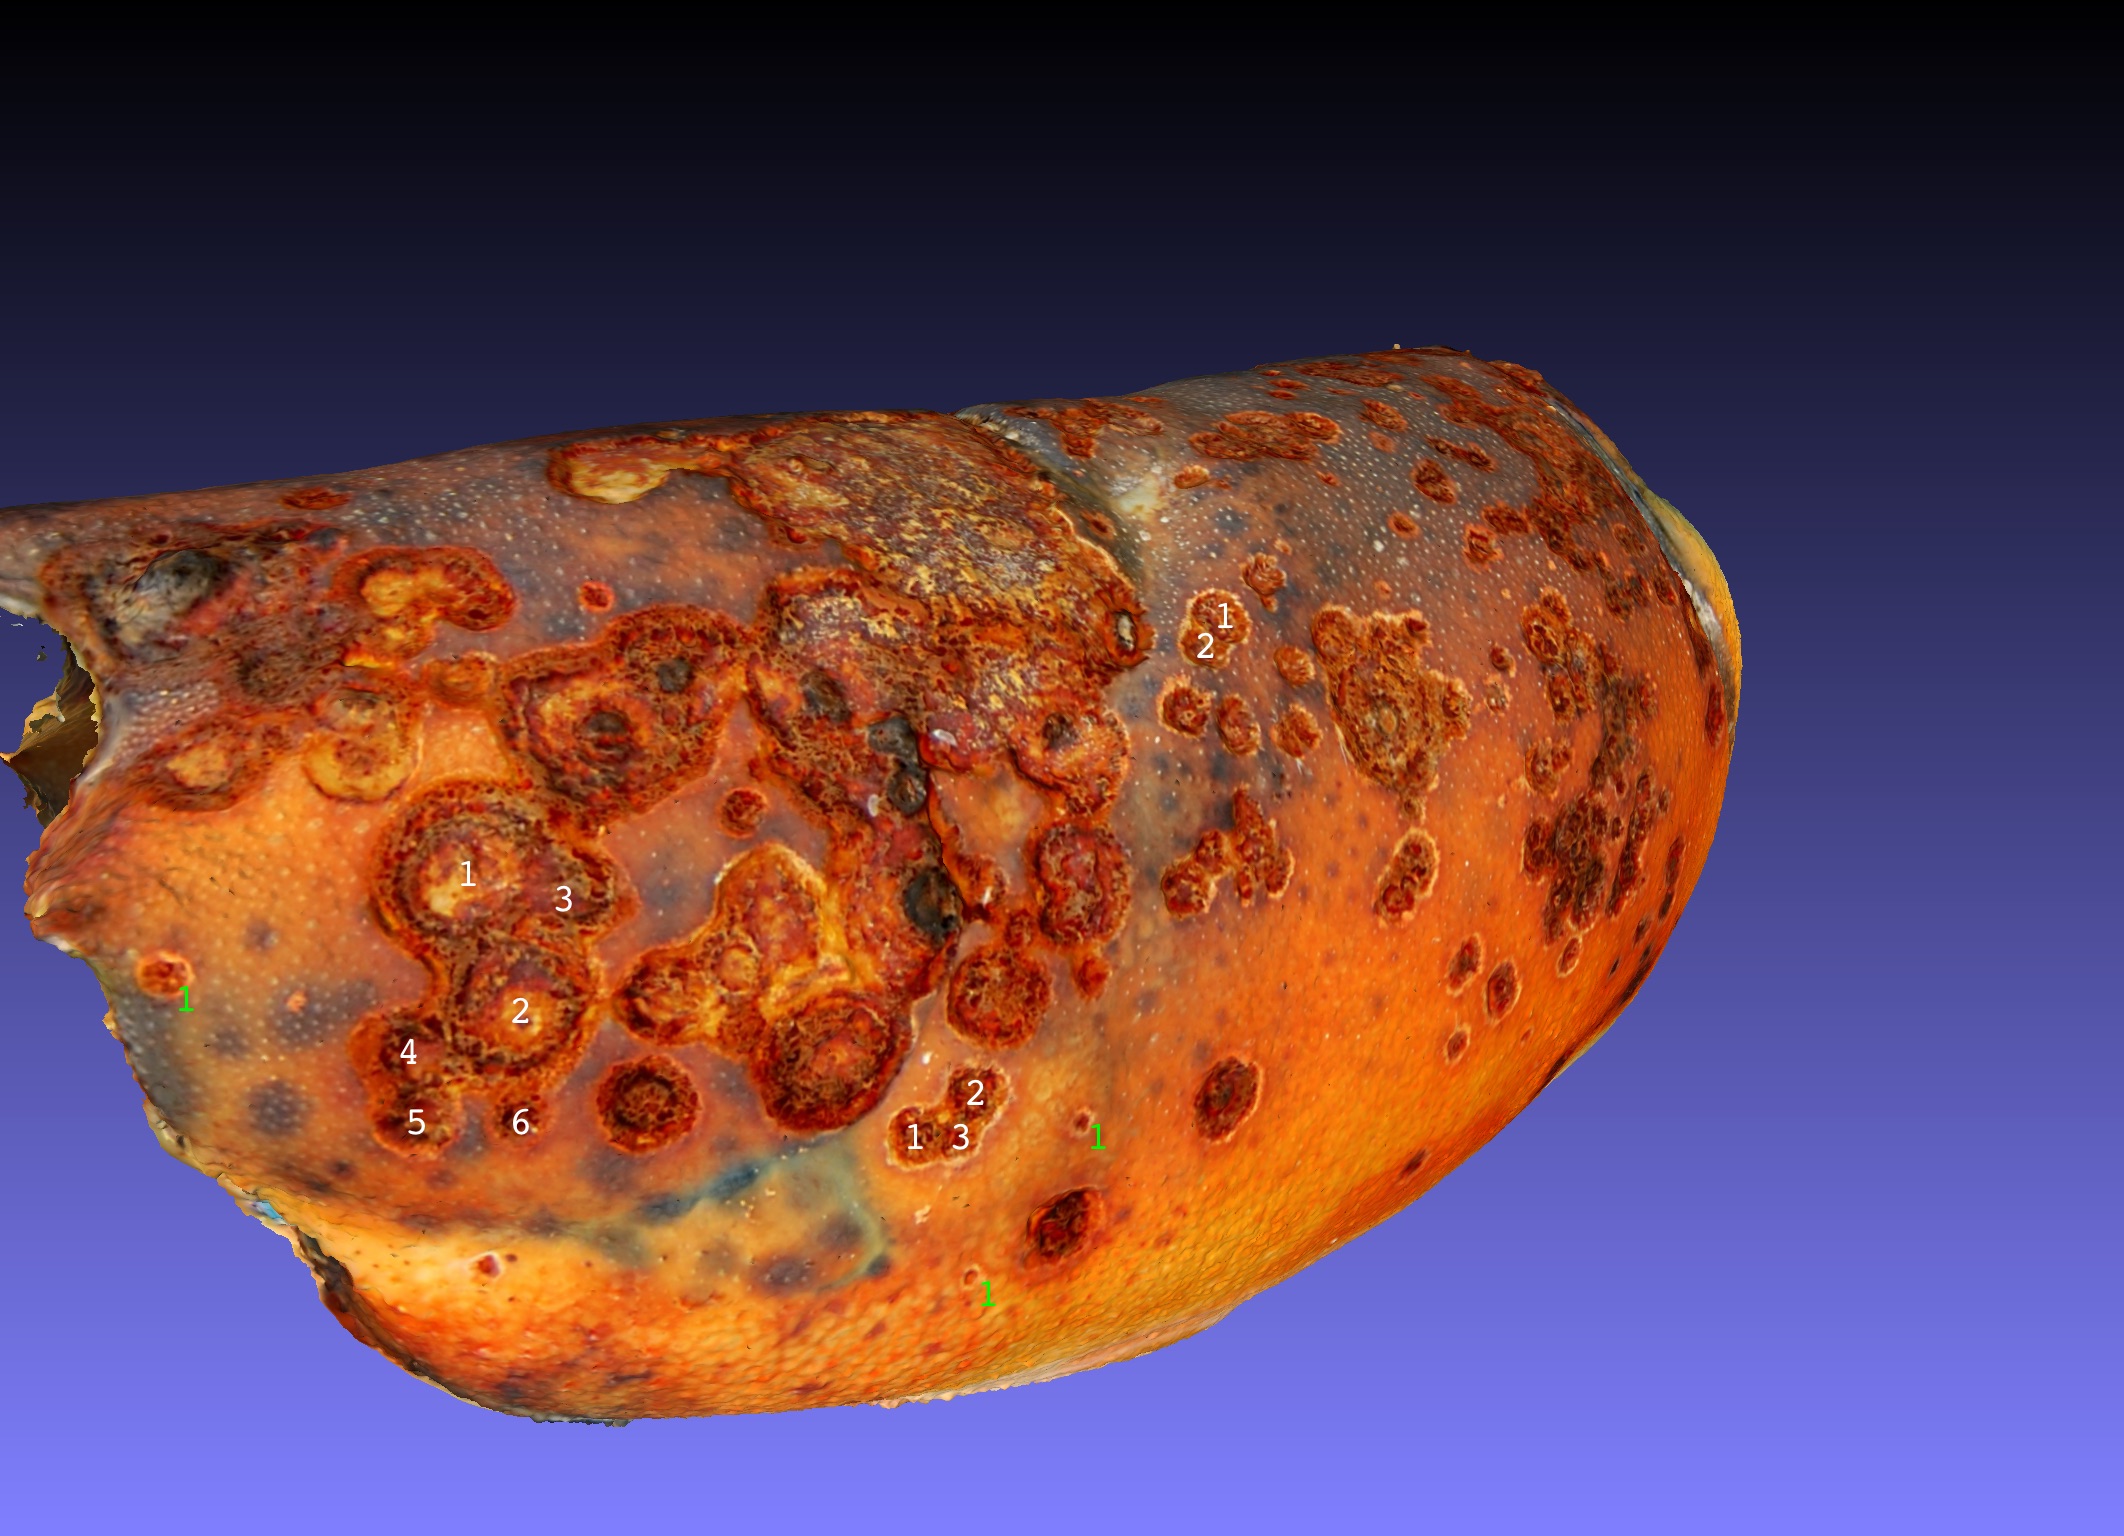
Construction of 3-dimensional models of the lobster carapace cuticle surface using photogrammetry allows the resolved surface features of the cuticle to be studied from any direction after the lobster is no longer available. I present one example of that approach by analysis of ESD lesions in a model of a lobster with level 2 ESD caught in Spring 2019 trawl 398. A model of lobster 1 from that trawl was created that can be viewed in a link to Sketchfab. That model was loaded into Meshlab and rotated to focus on four aspects of ESD lesion development. Fig 5A the symmetry of ESD lesions. Fig5B the origin of ESD lesions. Fig5C the merger of ESD lesions. Fig 5D, the development of ESD lesions.
A.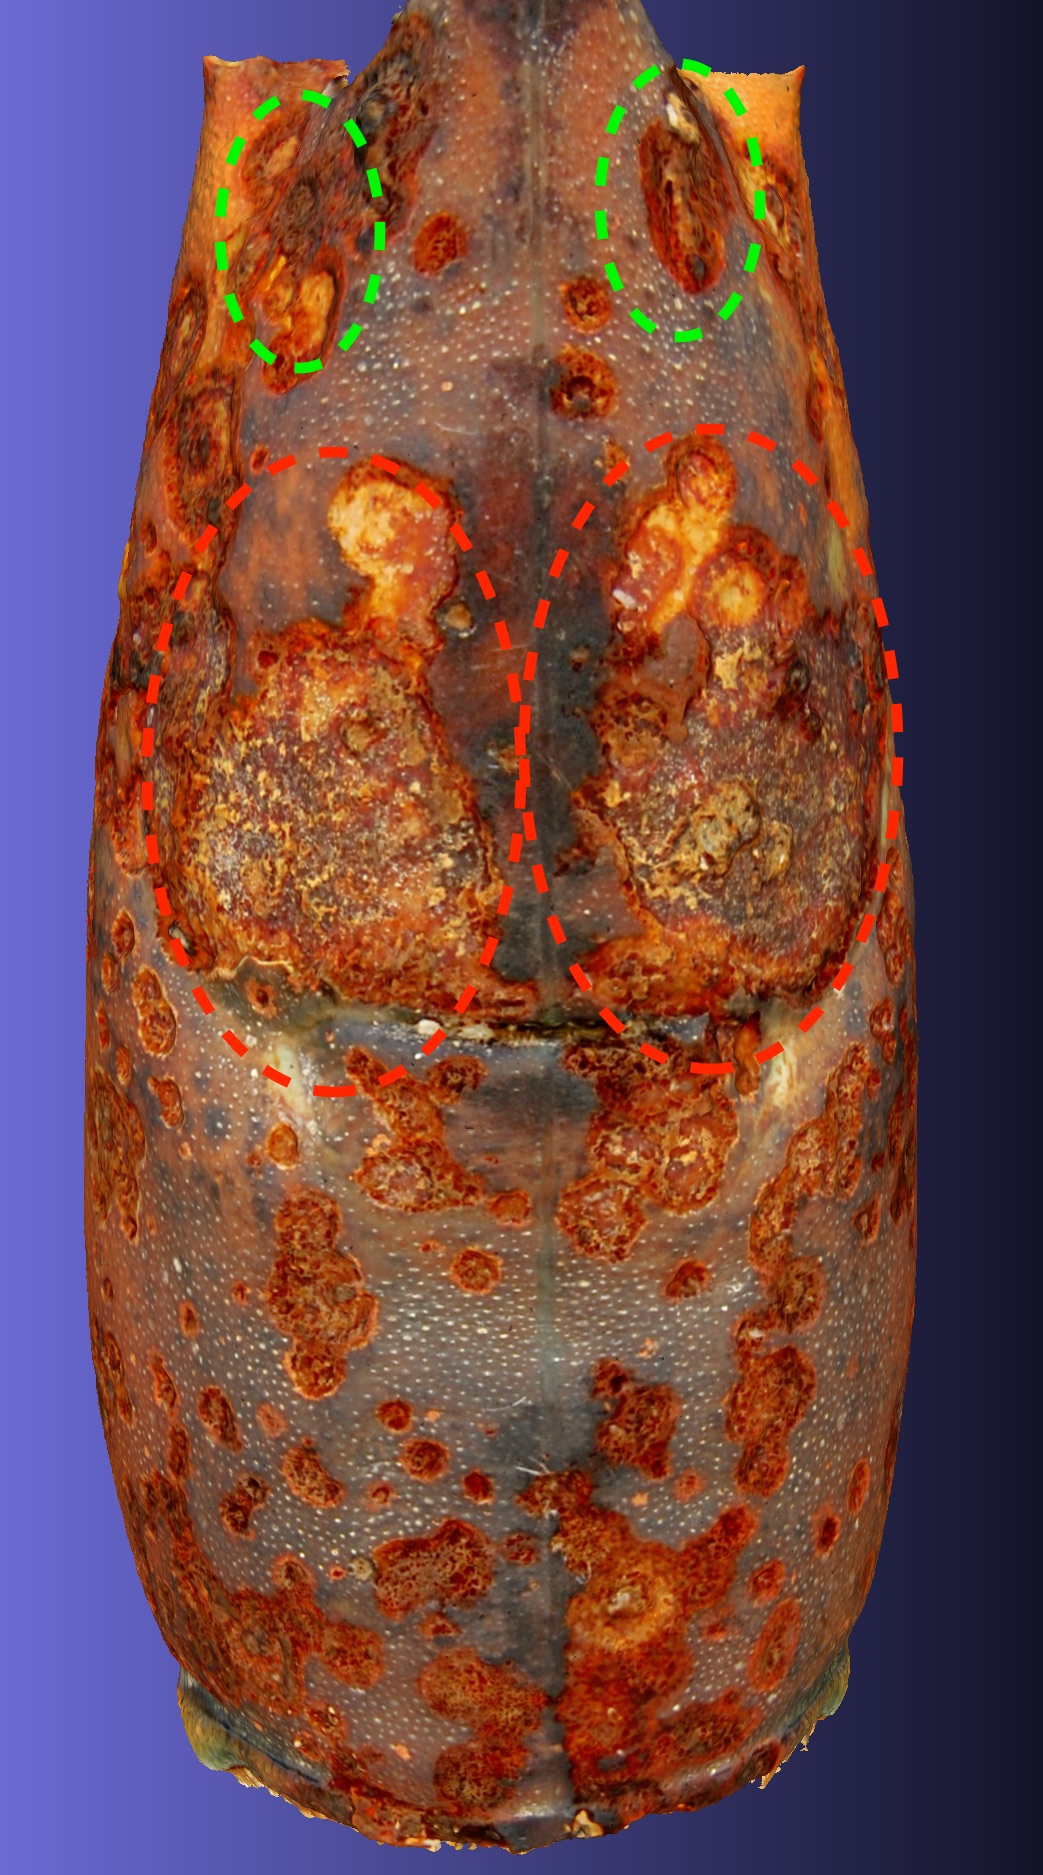
|
|
|
Consequences for Carapace Cuticle Model
The consequences of the sequential development of lesions can be viewed in Model 16, fig 6, of the Lobster Carapace Cuticle in the progression through the four defined layers of the cuticle starting with penetration through the apli-cuticle coded brown, then penetration through the epicuticle which is mainly protein and calcite devoid of chitin. It is also devoid of prophenoloxidase and thus does not tan dark brown. Next the lesion penetrates into the exocuticle which is layered with chitin and protein including pro-phenoloxidase which when activated creates a dark brown melanization. Lastly the lesion penetrates the endocuticle.
 |
Distribution of ESD in Lobster Populations
Preliminary results on the distribution of ESD within the NOAA Northeast Groundfish Survey for years 2018 and 2019 were assembled using scientists on legs 1-4 of the survey. The lobsters were examined from each trawl that yielded lobsters and either all lobsters were examined or a subsample was examined. The examined lobsters were measured for their carapace length, sex, presence of eggs, presence of barnacles, ESD score (0-3). If graded ESD 1-3 the lobster was frozen for transport to shore and confirmation of ESD and Photogrammetry. Fig 7 illustrates the counts of ESD and total lobsters at locations in the areas of the Groundfish Survey that yielded lobsters.

|
Shapes of Lobster Populations
Six populations of lobsters were identified based on geological location around the Gulf of Maine. The center of the Gulf of Maine is relatively empty of lobsters as seen in fig 7. Based on this geography we can define Georges Bank, Scotian Shelf, Off-shore Coastal Maine, and Cape Cod Bay populations that were collected from trawls of the NE Groundfish Survey. In addition an Inshore Coastal Maine population was sampled from the inshore lobster fishery. The average shapes by Landmark Analysis of these populations were determined and one can see the departures of each population from the average structure In figure 8.
A. 
|
B. Stereo AVI C. Shape Deformation Grid Table |
Those vectoral differences in shape can be interpreted as relative similarities and used to calculate a distance matrix Table I. Scotian Shoales and Georges Bank populations were decided to be too close to discriminate and were merged.
|
|
Table I. Distance between the average shapes of males (m) and females (f) of four lobster populations around the Gulf of Maine.
The distance matrix is used to calculate a shape similarity tree, fig 9

|
Discussion
The shape of the American lobster does differ between populations distributed around the Gulf of Maine. However the distribution of ESD seems to be somewhat even over the entire Gulf of Maine and Georges Bank as seen in the NOAA 2018-2019 NE Groundfish Survey seasons. One feature of this recorded ESD and normal data set is that the NE Groundfish Survey reports mainly on depths greater than 50 meters ignoring much of the inshore lobster population. The only segment of the groundfish survey that covers the inshore lobster population is in Cape Cod Bay. In that respect the shape relationship tree shows Cape Cod Bay carapace shapes to be closest to Inshore Main Coast lobsters. The carapace shapes of Offshore Main Coast are more similar in fig 9 to the Scotian Shelf and Georges Bank population.
Despite the relatively even distribution of ESD across the Gulf of Maine the observations are of relatively low frequency and it is a challenge to test whether these data represent a Poisson distribution of rare observations or if the observations are significantly clustered and reproducible. I will examine if the data are sufficient for such calculations in a subsequent post.
Bibliography
Berejnov V. (2009). Rapid and Inexpensive Reconstruction of 3D Structures for Micro-Objects Using Common Optical Microscopy, xxx.lanl.gov
Kunkel Joseph G, Melissa Rosa, Brian Tarbox, Sabine Hild, Michael J. Jercinovic, Ali N. Bahadur (2018). Recognizing Incipient Epizootic Shell Disease Lesions in the Carapace of the American Lobster, Homarus americanus, H. Milne Edwards 1837. Bull Mar Sci 94(3):863-886.
Rohlf FJ, D Slice. (1990). Extensions of the Procrustes Method for the Optimal Superimposition of Landmarks. Syst. Zool., 39(1):40-59.
Semyonov D. (2018). Metashape. Agisoft LLC, St. Petersburg, Russia. https://www.agisoft.com/forum/index.php?topic=9793.0
Smolowitz RM, Chistoserdov AY, Hsu A (2005) A description of the pathology of epizootic shell disease in the American lobster, Homarus americanus H. Milne Edwards 1837. J Shellfish Res 24:749−756


Comentários
Adicionar um Comentário